Openstack Autoscaling New Approach
Table of contents
NOTE(kiennt): There is a legacy Faythe guideline. The new version is coming soon, check its repository for status.
This guide describes how to automatically scale out your Compute instances in response to heavy system usage. By combining with Prometheus pre-defined rules that consider factors such as CPU or memory usage, you can configure OpenStack Orchestration (Heat) to add and remove additional instances automatically, when they are needed.
The standard OpenStack Autoscaling approach
Let’s talk about the standard OpenStack Autoscaling approach before goes to the new approach.
Main components
Orchestration: The core component providing automatic scaling is Orchestration (heat). Orchestration allows you to define rules using human-readable YAML templates. These rules are applied to evaluate system load based on Telemetry data to find out whether there is need to more instances into the stack. Once the load has dropped, Orchestration can automatically remove the unused instances again.
Telemetry: Telemetry does performance monitoring of your OpenStack environment, collecting data on CPU, storage and memory utilization for instances and physical hosts. Orchestration templates examine Telemetry data to access whether any pre-defined action should start.
- Ceilometer: a data collection service that provides the ability to normalise and transform data across all current OpenStack core components with work underway to support future OpenStack components.
- Gnocchi: provides a time-series resource indexing, metric storage service with enables users to capture OpenStack resources and the metrics associated with them.
- Aodh: enables the abiltity to trigger actions based on defined rules against sample or event data collected by Ceilometer.
Autoscaling process
For more details, you could check IBM help documentation
Drawbacks
- Ceilometer, Aodh are lacking of contribution. Ceilometer API was deprecated. Either Transform and pipeline was the same state, it means cpu_util will be unusable soon. In the commit message, @sileht - Ceilometer Core reviewer wrote that “Also backend like Gnocchi offers a better alternative to compute them”. But Aodh still deprecated Gnocchi aggregation API which doesn’t support
rate:mean. For more details, you can follow the issue I’ve opened before. Be honest, I was gave up on it - 3 projects which was tightly related together, one change might cause a sequence and break the whole stack, how can I handle that? - Aodh has its own formula to define rule based on Ceilometer metrics (that were stored in Gnocchi). But it isn’t correct sometimes cause the wrong scaling action.
- In reality, I face the case that Rabbitmq was under heavy load due to Ceilometer workload.
- IMO, Gnocchi documentation is not good enough. It might be a bias personal opinion.
The new approach with Faythe
The idea
Actually, this isn’t a complete new approach, it still leverages Orchestration (heat) to do scaling action. The different comes from Monitor service.
Take a look at Rico Lin - Heat’s PTL, autoscale slide, basically, Autoscaling is the combination of 3 steps:
- Metering.
- Alarm.
- Scale.
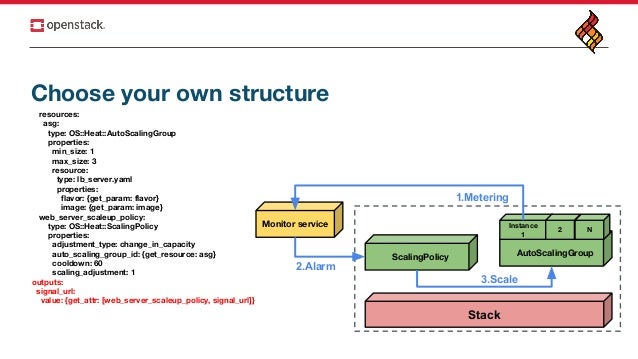
OpenStack Telemetry takes care of Metering and Alarm. Ok, the new approach is simply using another service that can take Telemetry roles.
The another service is Prometheus stack. The question here is why I chose this?
- Nice query language: Prometheus provides a functional query language called PromQL (Prometheus Query Language) that lets the user select and aggregate time series data in real time.
- A wide range of exporter: The more exporter the more metrics I can collect and evaluate.
- Flexibile: Beside the system factor like CPU/Memory usage, I can evaluate any metrics I can collect, for example: JVM metrics.
- // Take time to investigate about Prometheus and fill it here by yourself
The implementation
The ideal architecture
                                               ------------------------------------------------+--+
                                               |                                                  |
                                               |     ---------------+--+  ---------------+--+     |
---------------------++                        |     |   Instance 1    |  |   Instance 2    |     |
|                     |                        |     |                 |  |                 |     |
|                     |            Scrape Metrics    |  ---------+--+  |  |  ---------+--+  |     |
|  Prometheus server  <------------------------------+--+Exporter(s)|  |  |  |Exporter(s)|  |     |
|                     |                        |     |  ---------+--+  |  |  ---------+--+  |     |
|                     |                        |     ---------------+--+  ---------------+--+     |
---------+----------+-+                        |     ------------------------------------+--+     |
           |                                   |     |           Autoscaling Group          |     |
           | Fire alerts                       |     ------------------------------------+--+     |
           |                                   |                                                  |
           |                                   |                                                  |
---------+-v------------+                      |     ------------------------------------+--+     |
|                       |         Send scale request |                                      |     |
|Prometheus Alertmanager---------------------+----+-->          Scaling Policy              |     |
|                       |                      |     |                                      |     |
---------------------+--+                      |     ------------------------------------+--+     |
                                               |                                                  |
                                               |                     Heat Stack                   |
                                               ------------------------------------------------+--+
- Prometheus server scrapes metrics from exporters that launch inside Instance.
- Prometheus server evaluates metrics with pre-defined rules.
- Prometheus server fires alert to Prometheus alertmanager.
- Prometheus alertmanager sends POST Scale request to Heat Scaling policy with webhook configuration.
It’s a piece of cake, right? But where is Faythe, I don’t see it? Let’s talk about the solution problems:
- Prometheus Alertmanager webhook config doesn’t support additional HTTP headers. And they won’t! :cry: Heat Scaling Policy signal url requires
X-Auth-Tokenin header and Prometheus can’t generate a token itself, either. - Heat doesn’t recognize the resolved alerts from Prometheus Alertmanager to execute scale in action.
- How to connect these components together?
We need a 3rd service to solve these problems - Faythe does some magic.
The reality architecture
                                              ------------------------------------------------++-+
                                               |                                                  +
                                               |     ---------------+--+  ---------------+--+     |
---------------------++                        |     |   Instance 1    |  |   Instance 2    |     |
|                     |                        +     |                 |  |                 |     |
|                     |            Scrape Metrics    |  ---------+--+  |  |  ---------+--+  |     |
|  Prometheus server  <------------------------------+--+Exporter(s)|  |  |  |Exporter(s)|  |     |
|                     |                        |     |  ---------+--+  |  |  ---------+--+  |     |
|                     |                        |     ---------------+--+  ---------------+--+     |
---------+----------+-+                        |     ------------------------------------+--+     |
           |                                   |     |           Autoscaling Group          |     |
           | Fire alerts                       |     ------------------------------------+--+     |
           |                                   |                                                  |
           |                                   |                                                  |
---------+-v------------+                      |     ------------------------------------+--+     |
|                       |                      |     |                                      |     |
|Prometheus Alertmanager|                      |                Scaling Policy              |     |
|                       |                      |     |                                      |     |
---------+-----------+--+                      |     ---+--^--------------------------------+     |
            |                                  |           |                                      |
            | Send request through             |           |         Heat Stack                   |
            | pre-configured webhook           ------------------------------------------------+--+
            |                                              |
---------+--v-----------+                                  |
|                       |                                  |
|        Faythe         ---------------------------------+-+
|                       |       Send actual scale request
---------------------+--+
NOTE: The stack leverages OpenStack instance metadata and Prometheus labels.
- Prometheus server scrapes metrics from exporters that launch inside Instance.
- Prometheus server evaluates metrics with pre-defined rules.
- Prometheus server fires alert to Prometheus alertmanager.
- Prometheus alertmanager sends Alerts via pre-configured webhook URL - Faythe endpoint.
- Faythe receives and processes Alerts (dedup, group alert and generate a Heat signal URL) and creates a POST request to scale endpoint.
Guideline
The current aprroach requires some further setup and configuration from Prometheus and Heat stack. You will see that it’s quite complicated.
The simplify in logic is paid by the complex config steps.
Step 1: Create a stack - the following is the sample template. It has several requirements:
- OS::Heat::ScalingPolicy has to be named as
scaleout_policyandscalein_policy. - OS::Heat::AutoScalingGroup’s instance metadata has to contain
stack_asg_nameandstack_asg_id. It will be used to generate signal URL. - Instance should have a cloud init script to enable and start Prometheus exporters automatically.
---
resources:
  asg:
    type: OS::Heat::AutoScalingGroup
    properties:
      min_size: { get_param: min_size }
      max_size: { get_param: max_size }
      resource:
        type: { get_param: service_template }
        properties:
          flavor: { get_param: flavor }
          image: { get_param: image }
          key_name: { get_param: key_name }
          network: { get_param: network }
          subnet: { get_param: subnet }
          metadata: {
              "monitoring": "1", ## Required
              "service": "myservice",
              "stack_asg_name": { get_param: "OS::stack_name" }, ## Required
              "stack_asg_id": { get_param: "OS::stack_id" }, ## Required
            }
          security_group: { get_param: security_group }

  scaleout_policy: ## Have to be named as `scaleout_policy`
    type: OS::Heat::ScalingPolicy
    properties:
      adjustment_type: change_in_capacity
      auto_scaling_group_id: { get_resource: asg }
      cooldown: { get_param: scale_out_cooldown }
      scaling_adjustment: { get_param: scaling_out_adjustment }

  scalein_policy: ## Have to be named as `scalein_policy`
    type: OS::Heat::ScalingPolicy
    properties:
      adjustment_type: change_in_capacity
      auto_scaling_group_id: { get_resource: asg }
      cooldown: { get_param: scale_in_cooldown }
      scaling_adjustment: { get_param: scaling_in_adjustment }
Step 2: Configure Prometheus openstack discovery
- job_name: openstack_scale_test
  openstack_sd_configs:
    - role: instance
      identity_endpoint: "<openstackendpoint>"
      username: "<openstackusername>"
      password: "<openstackpassword>"
      domain_name: "default"
      port: 9100 ## Exporter endpoint
      refresh_interval: 20s
      region: "RegionOne"
      project_name: "<openstackproject>"

  relabel_configs:
    ## Only keep metrics from ACTIVE instance
    - source_labels: [__meta_openstack_instance_status]
      action: keep
      regex: ACTIVE

    ## Only scrape from instance with monitoring tag
    - source_labels: [__meta_openstack_tag_monitoring]
      action: keep
      regex: 1

    - source_labels: [__meta_openstack_project_id]
      target_label: project_id
      replacement: $1

    - source_labels: [__meta_openstack_tag_stack_asg_name]
      target_label: stack_asg_name
      replacement: $1

    - source_labels: [__meta_openstack_tag_stack_asg_id]
      target_label: stack_asg_id
      replacement: $1
Step 3: Define a Prometheus rule, for example:
groups:
  - name: targets
    rules:
      - alert: high_memory_load
        expr: avg by(stack_asg_id, stack_asg_name, project_id) ((node_memory_MemTotal_bytes{service="myservice"} - node_memory_MemFree_bytes{service="myservice"}) / node_memory_MemTotal_bytes{service="myservice"} * 100) > 80
        for: 5m
        labels:
          severity: critical
        annotations:
          summary: "High memory"
          description: "Instance {{ $labels.instance }} of job {{ $labels.job }} (stack {{ $labels.stack_id }} has been high af for 5m"
Step 4: Configure Prometheus Alertmanager webhook, for example:
route:
  receiver: "custom_alert"
  group_wait: 20s
  group_interval: 3m

receivers:
  - name: "custom_alert"
    webhook_configs:
      - send_resolved: true
        url: http://<faythe-host>:<faythe-port>/openstack/autoscaling/openstack-1f
        http_config:
          basic_auth:
            username: "admin"
            password: "password"
Note that, openstack-1f has to be the name of OpenStack configuration group in Faythe config file. It helps Faythe to work with multiple OpenStack.
Step 5: Configure Faythe
## OpenStackConfiguration.
openstack_configs:
  openstack-1f:
    region_name: "RegionOne"
    domain_name: "Default"
    auth_url: "<openstackendpoint>"
    username: "<openstackusername>"
    password: "<openstackpassword>"
    project_name: "<openstackproject>"

server_config:
  ## Example:
  ## "www.example.com"
  ## "([a-z]+).domain.com"
  ## remote_host_pattern: "10.240.202.209.*"
  basic_auth:
    username: "admin"
    password: "password"
  log_dir: "/whatever/directory/faythe-logs"
Step 6: Let’s make them work:
- Prometheus server.
- Prometheus alertmanager.
- Faythe.
Drawbacks and TODO
Drawbacks
- The configuration steps is way too complicated, many manual steps have to be done.
TODO
- Simplify strategy, might need a service discovery.