Features
ClickLens provides a comprehensive suite of tools for managing and monitoring ClickHouse databases. This guide covers all major features and how to use them.
1. Discover (Kibana-like Data Exploration)
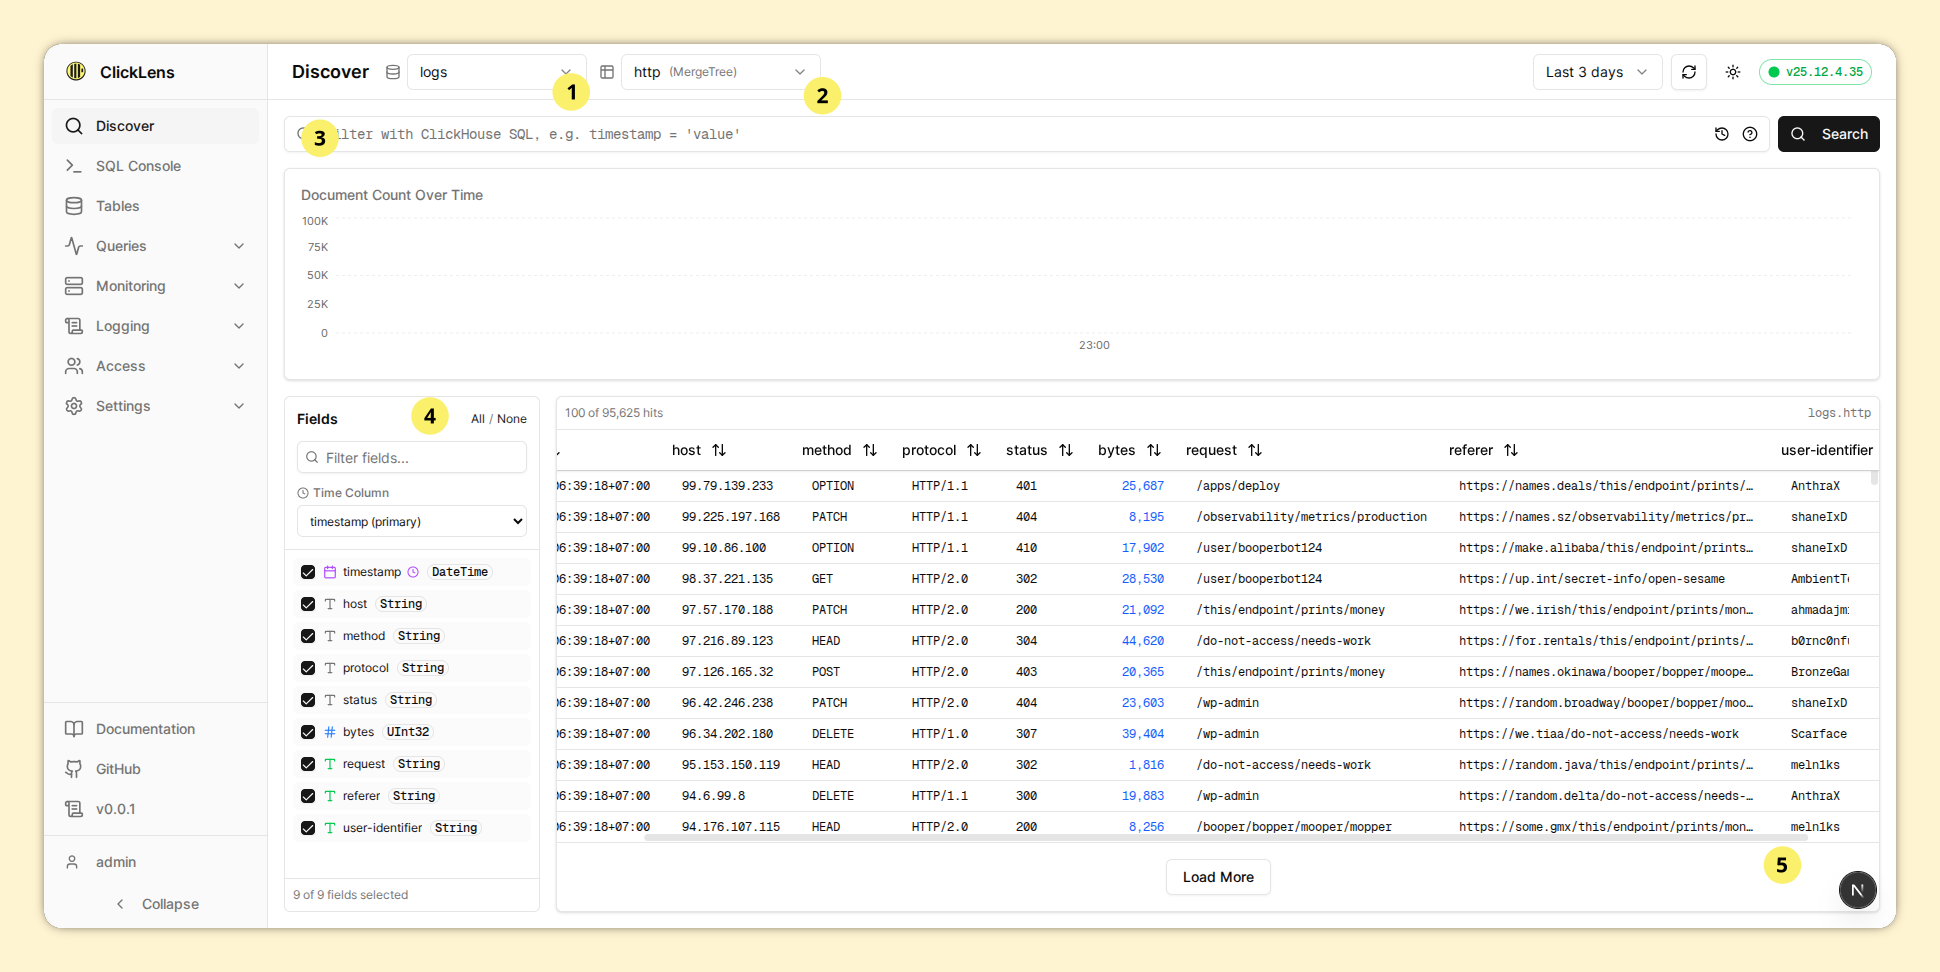
The Discover feature provides a flexible, Kibana-style interface for exploring data in any ClickHouse table—not just logs.
Requires canDiscover permission. This permission is derived from having
SHOW TABLES and SELECT access on at least one table.
1.1. Key Components
Database & Table Selection
Use the dropdowns in the header to select your data source:
- Database Selector: Choose from available databases
- Table Selector: Shows tables with their engine type (e.g., MergeTree, ReplicatedMergeTree)
Fields Sidebar
The left sidebar controls which columns appear in your query:
- Search: Filter columns by name
- Select All / None: Quick selection toggles
- Time Column Picker: Choose which DateTime column to use for time filtering
- Type Icons: Visual indicators for column types (DateTime, String, Number, Boolean)
Only selected columns are included in the SELECT clause. This affects both
the data grid and query performance.
Query Bar
Enter custom ClickHouse WHERE clause expressions:
level = 'Error'
status >= 400
host LIKE '%api%'
message ILIKE '%timeout%'
level IN ('Error', 'Fatal')
Features:
- Query History: Persisted in localStorage (up to 20 entries)
- Syntax Help: Hover over the help icon for examples
- Execute: Press Enter or click Search
Time Range Selector
Filter data by time using presets:
- Minutes: 5m, 15m, 30m
- Hours: 1h, 3h, 6h, 12h, 24h
- Days: 3d, 7d
Histogram
When a time column is selected, a bar chart shows document distribution over time:
- Click a bar to zoom into that time range
- Reset Zoom button to return to the selected preset
Results Grid
- Row Count: Shows "X of Y hits"
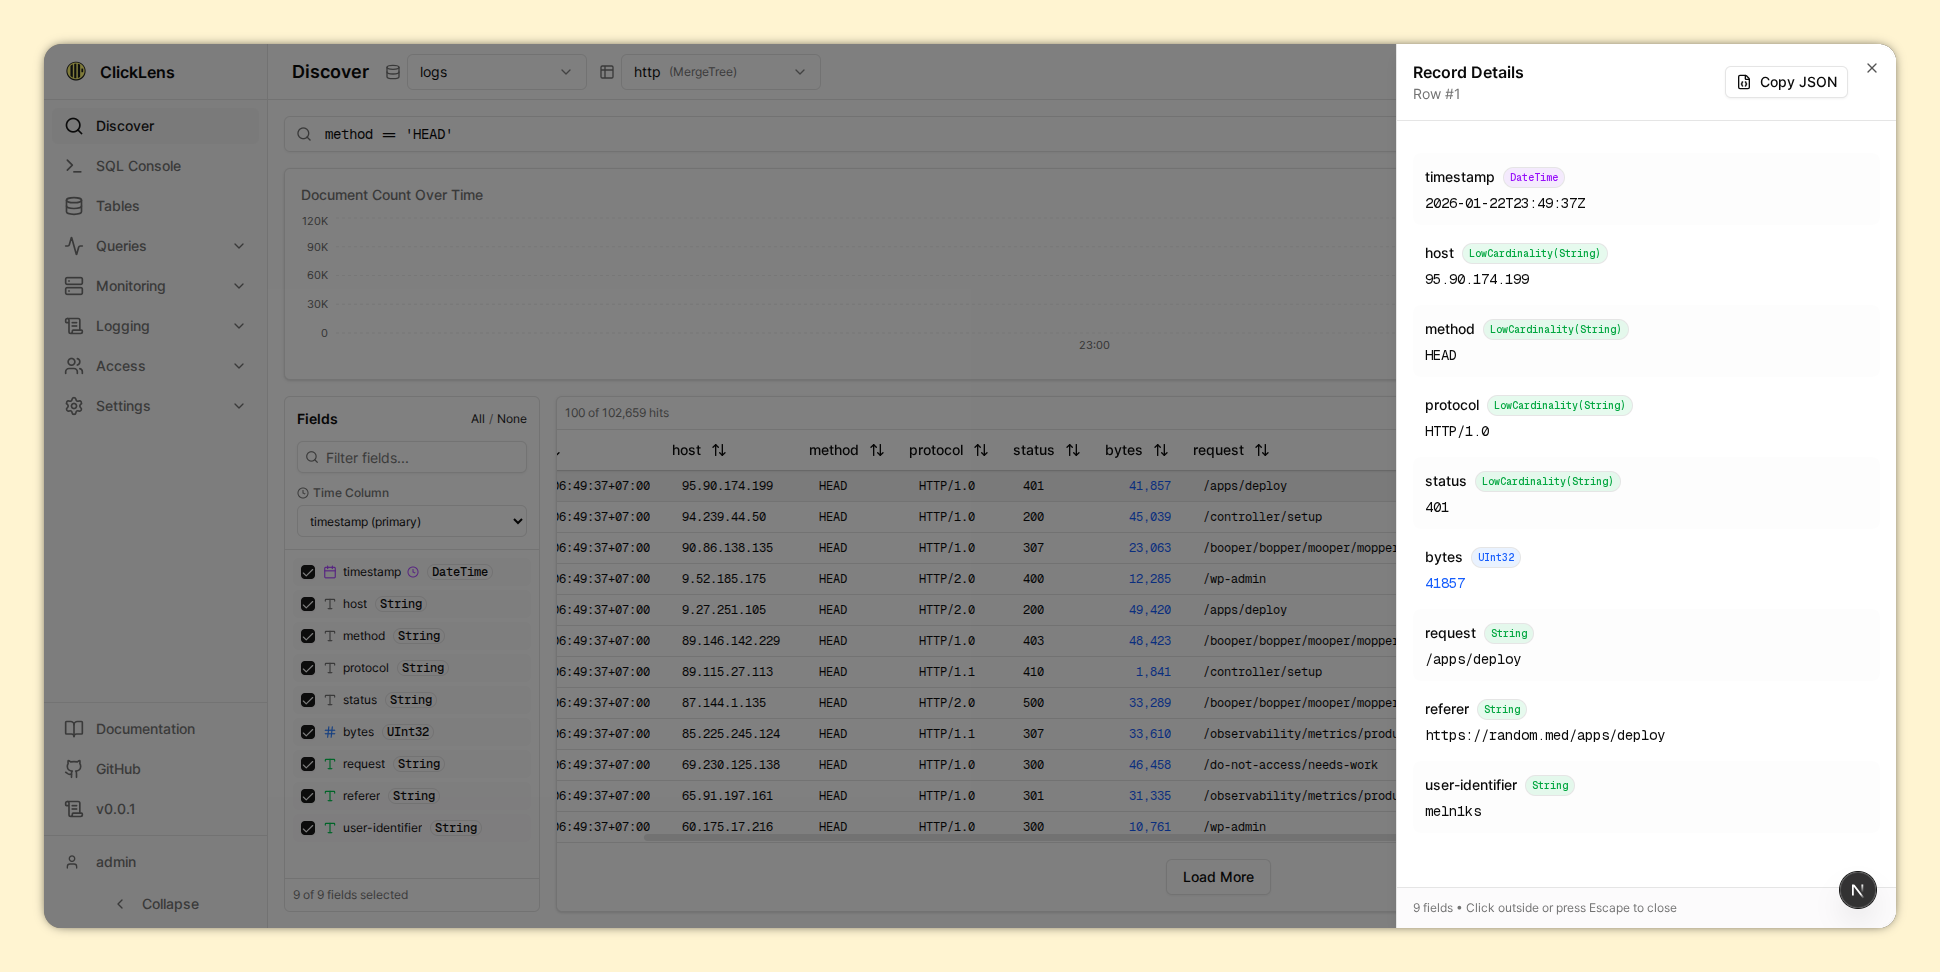
- Row Detail: Click any row to see all fields in a slide-out panel
- Load More: Offset-based pagination for large result sets

1.2. Query Syntax Guide
Basic Filters
column = value
column > 100
column LIKE '%pattern%'
column IN (1, 2, 3)
column BETWEEN 1 AND 100
column IS NULL
Complex Filters
column1 = value1 AND column2 > 100
column1 = value1 OR column2 = value2
NOT column = value
(column1 = value1 OR column2 = value2) AND column3 > 100
Time Filters
event_time >= '2024-01-01'
event_time BETWEEN '2024-01-01' AND '2024-01-31'
event_time >= toDateTime64(1704067200, 3)
Order By Syntax
column:asc
column:desc
column1:desc,column2:asc
Group By Syntax
column
column1,column2
1.3. Performance & Security
Performance Optimizations:
- Progressive time windows based on date range
- Row windowing (50 rows buffer) to prevent memory issues
- Parallel chunk queries (max 3 concurrent)
- Query caching for repeated queries
- Adaptive histogram height (100px-250px)
Security Features:
- SQL injection protection (blocks dangerous operations)
- Query timeout enforcement (default 60s, max 300s)
- Rate limiting (10 queries per minute per user)
- Full RBAC compatibility
1.4. Troubleshooting
Query Timeout: Add more specific filters, use time range filtering, select fewer columns
Rate Limit Exceeded: Wait a minute, use query caching, contact admin to increase limit
SQL Validation Error: Remove dangerous keywords, use only SELECT-compatible syntax
Slow Query Performance: Add time filters, reduce limit, select fewer columns, use GROUP BY
No Results Returned: Check database/table, verify time range, check filter conditions, ensure RBAC access
2. SQL Console
A full-featured SQL editor for writing and executing ClickHouse queries.
Requires canExecuteQueries permission. This is derived from having
SELECT access on at least one database.
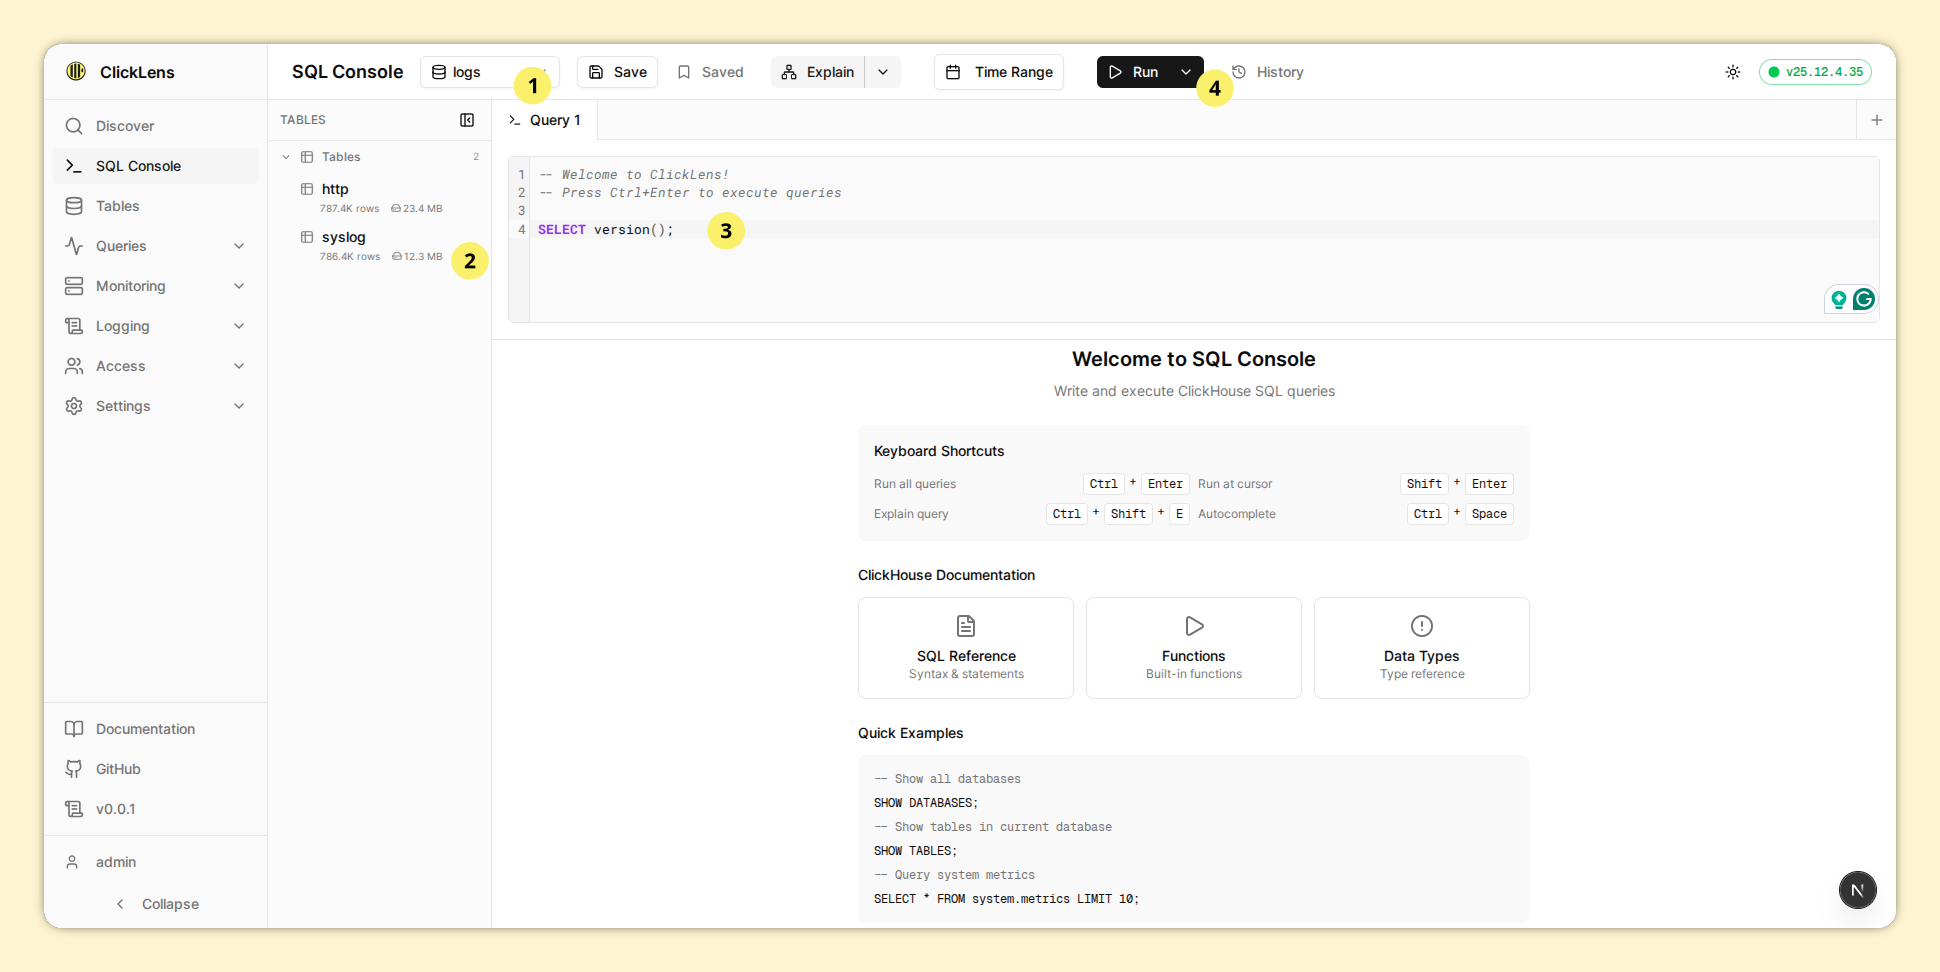
2.1. Key Features
Multi-Tab Support
- Open multiple query tabs simultaneously
- Tabs are persisted locally (SQL content survives browser refresh)
- Each tab maintains its own result set and history
SQL Editor
Built on CodeMirror 6 with ClickHouse-specific enhancements:
- Syntax Highlighting: Keywords, functions, strings, numbers
- Context-Aware Autocomplete:
- Keywords after
FROM,JOIN→ table suggestions - After
USE,DATABASE→ database suggestions - After table reference → column suggestions (async fetch)
- Built-in functions and keywords
- Keywords after
- Code Actions: Execute, Explain, Format
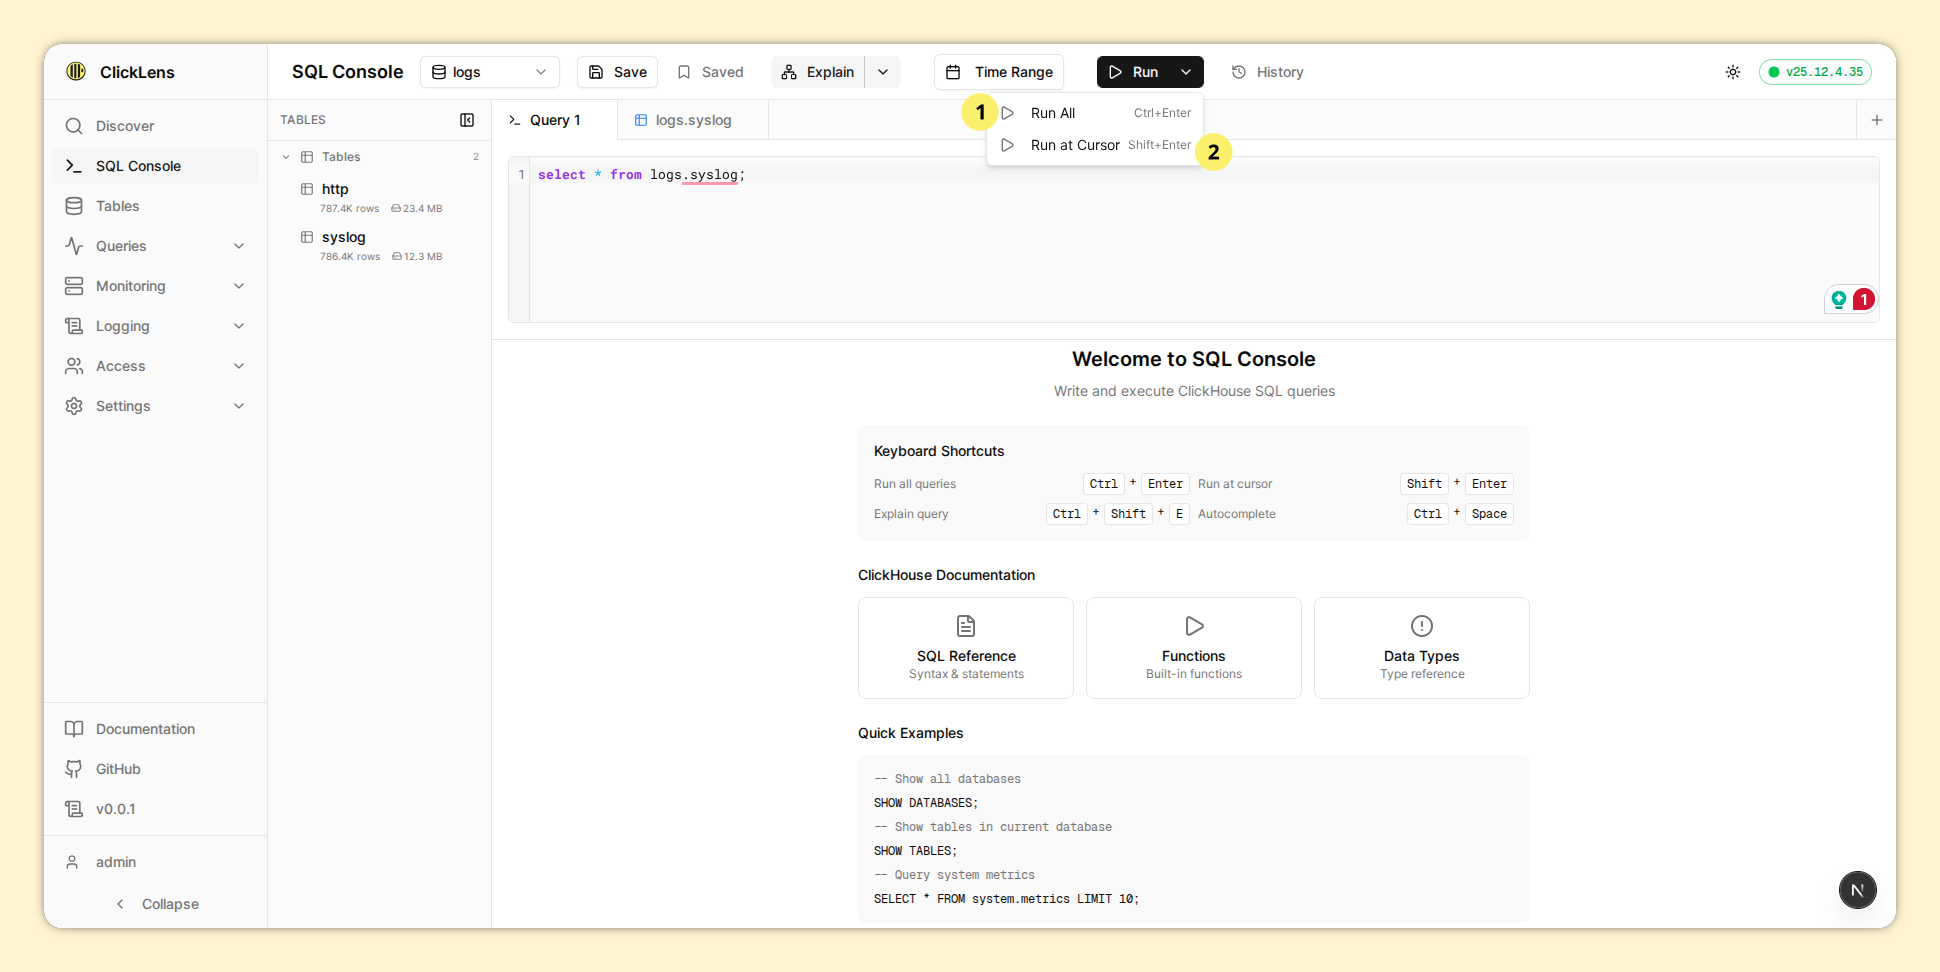
Execution Modes
| Shortcut | Action |
|---|---|
Ctrl+Enter | Execute all statements in the editor |
Ctrl+Shift+Enter | Execute only the statement at cursor position |
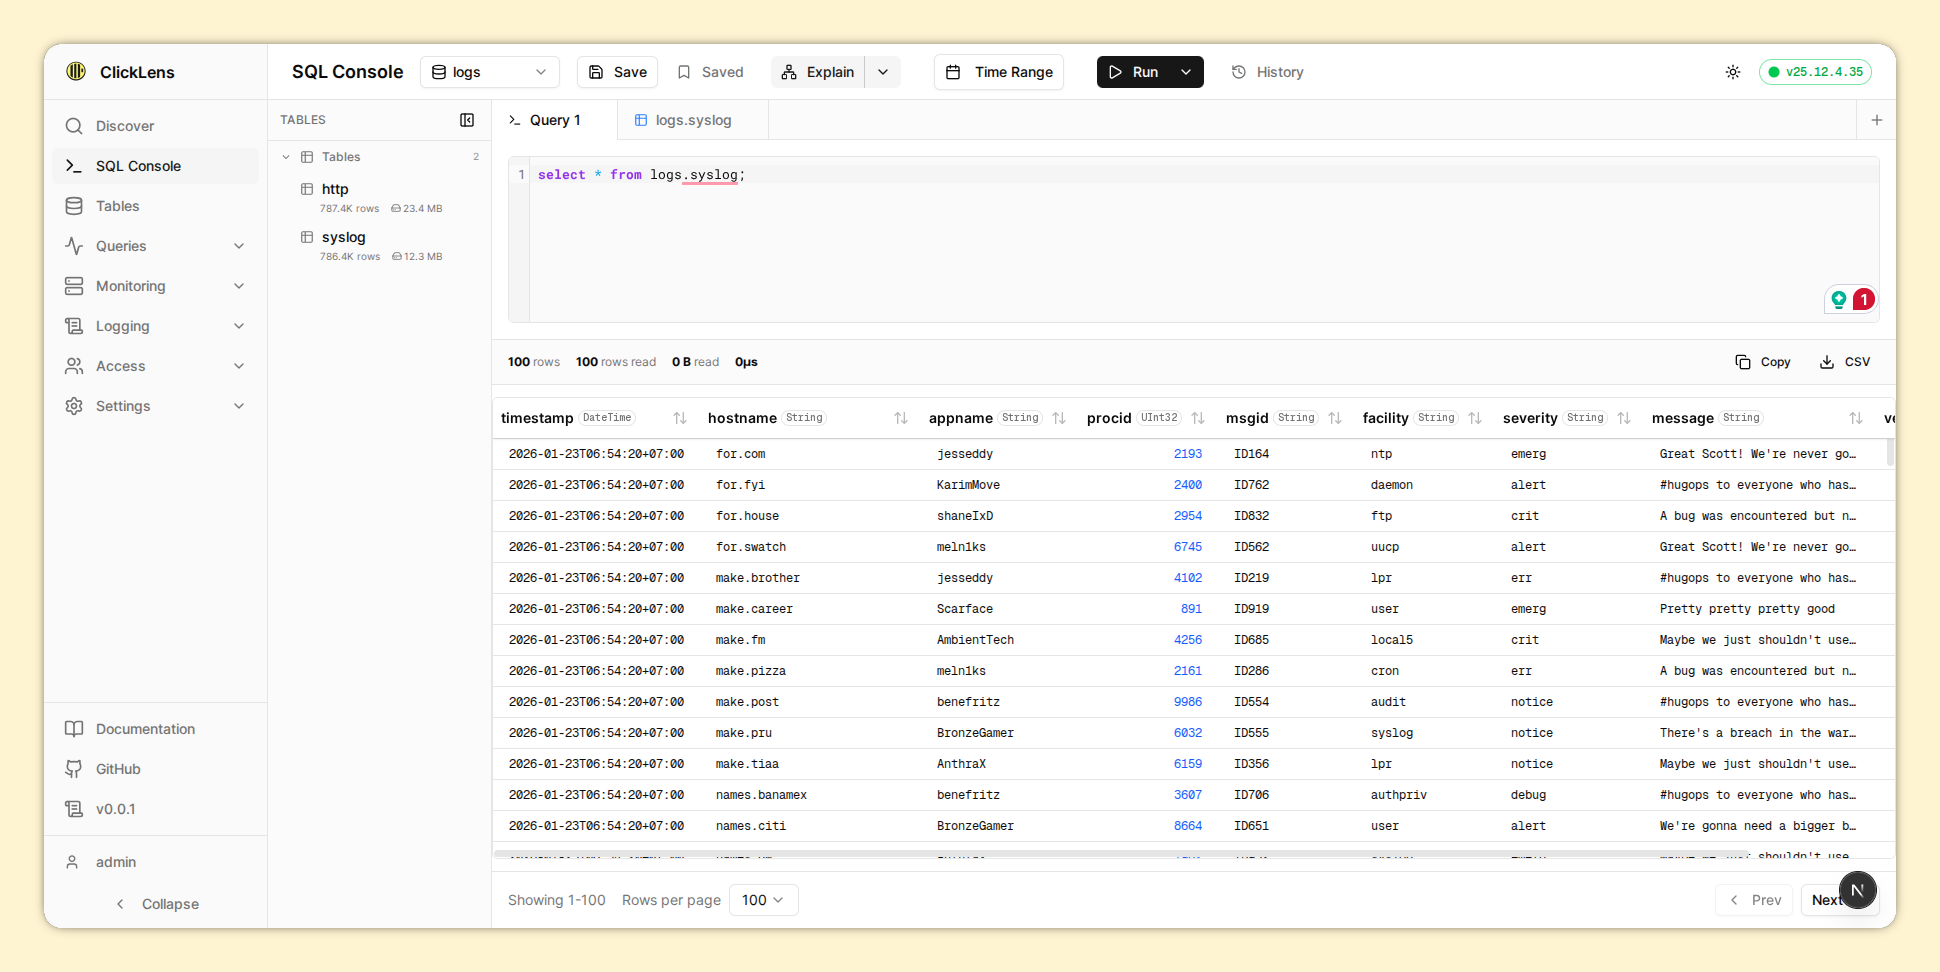
Query Streaming
Large result sets are streamed to the UI using NDJSON:
- Progress indicator shows rows being fetched
- Results appear incrementally
- Cancel running queries with the Stop button
Explain Queries
Use the Explain dropdown to analyze query plans:
- AST: Abstract Syntax Tree
- SYNTAX: Normalized query syntax
- PLAN: Query execution plan
- PIPELINE: Processing pipeline visualization
Saved Queries
Save frequently-used queries for quick access:
- Click the Save icon to store a query
- Access saved queries from the Bookmarks panel
- Queries are stored server-side
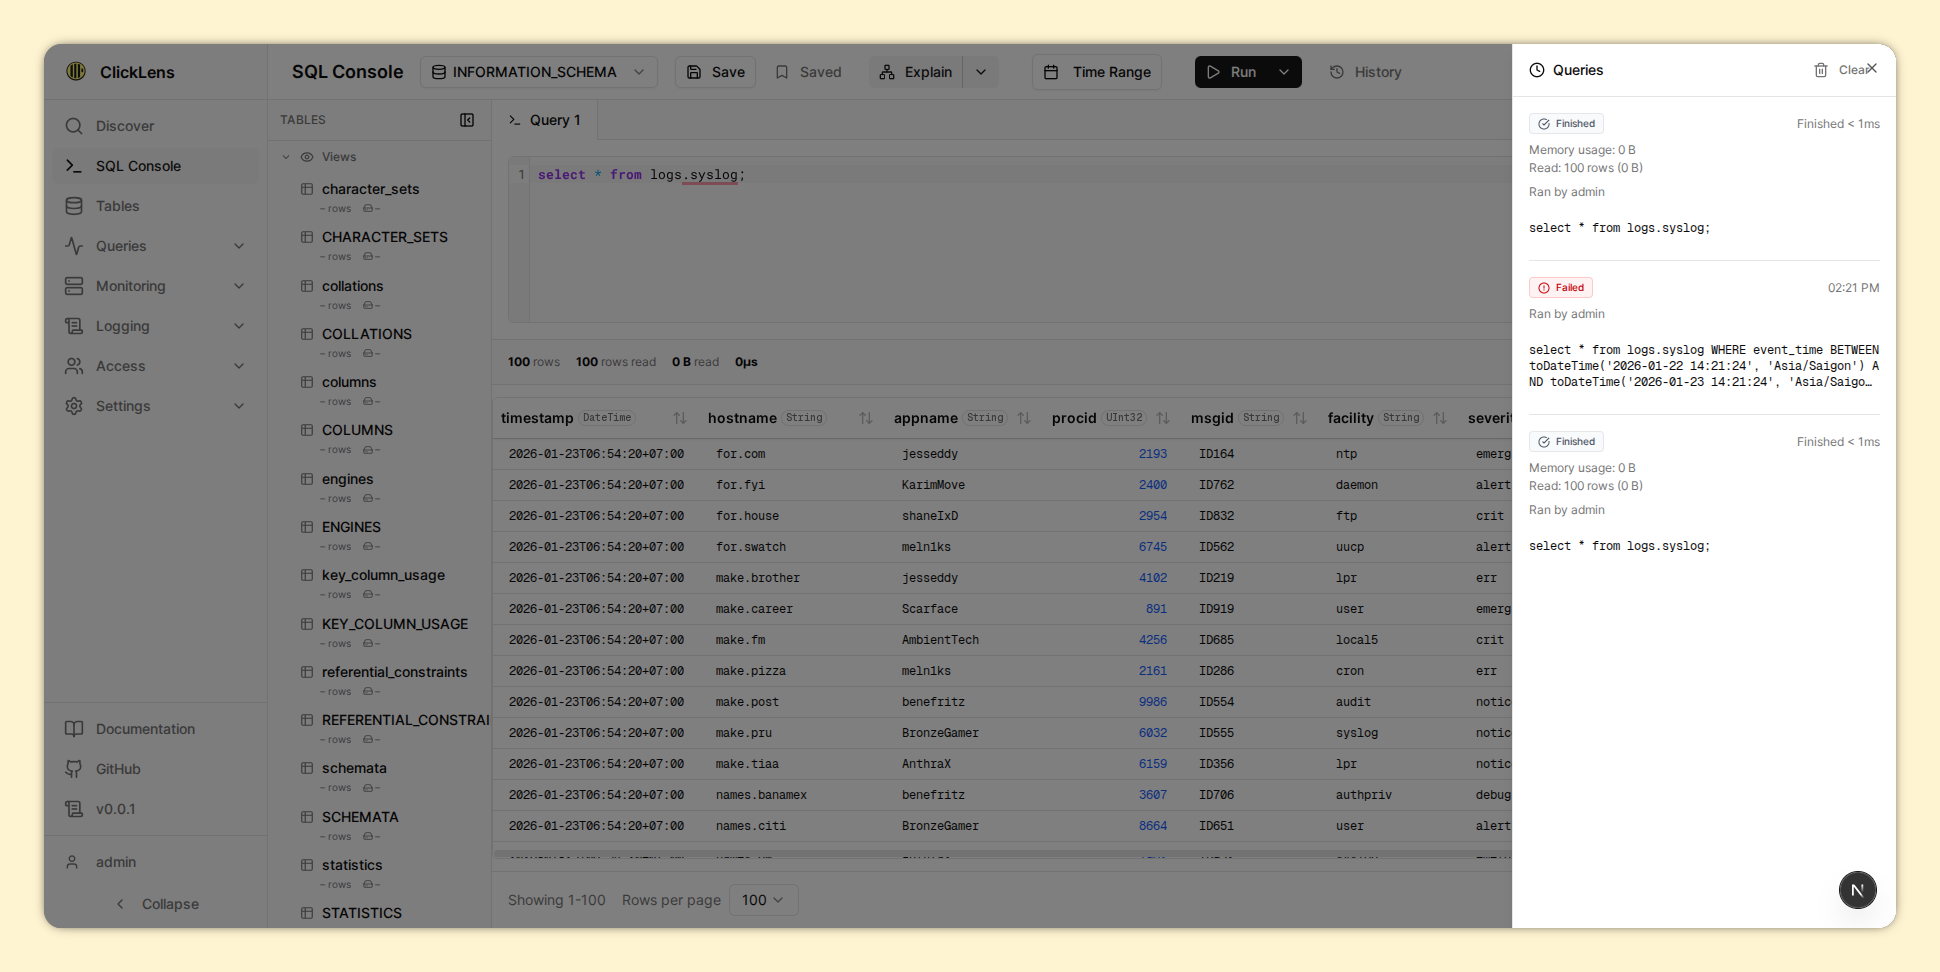
Query History
The History panel shows recent executions with:
- SQL text
- Duration
- Rows returned / read
- Bytes read
- Memory usage
- User who ran it
- Errors (if any)
Time Range Insertion
Use the Time Range Selector to quickly insert time filter clauses into your SQL, properly handling the WHERE vs AND syntax.
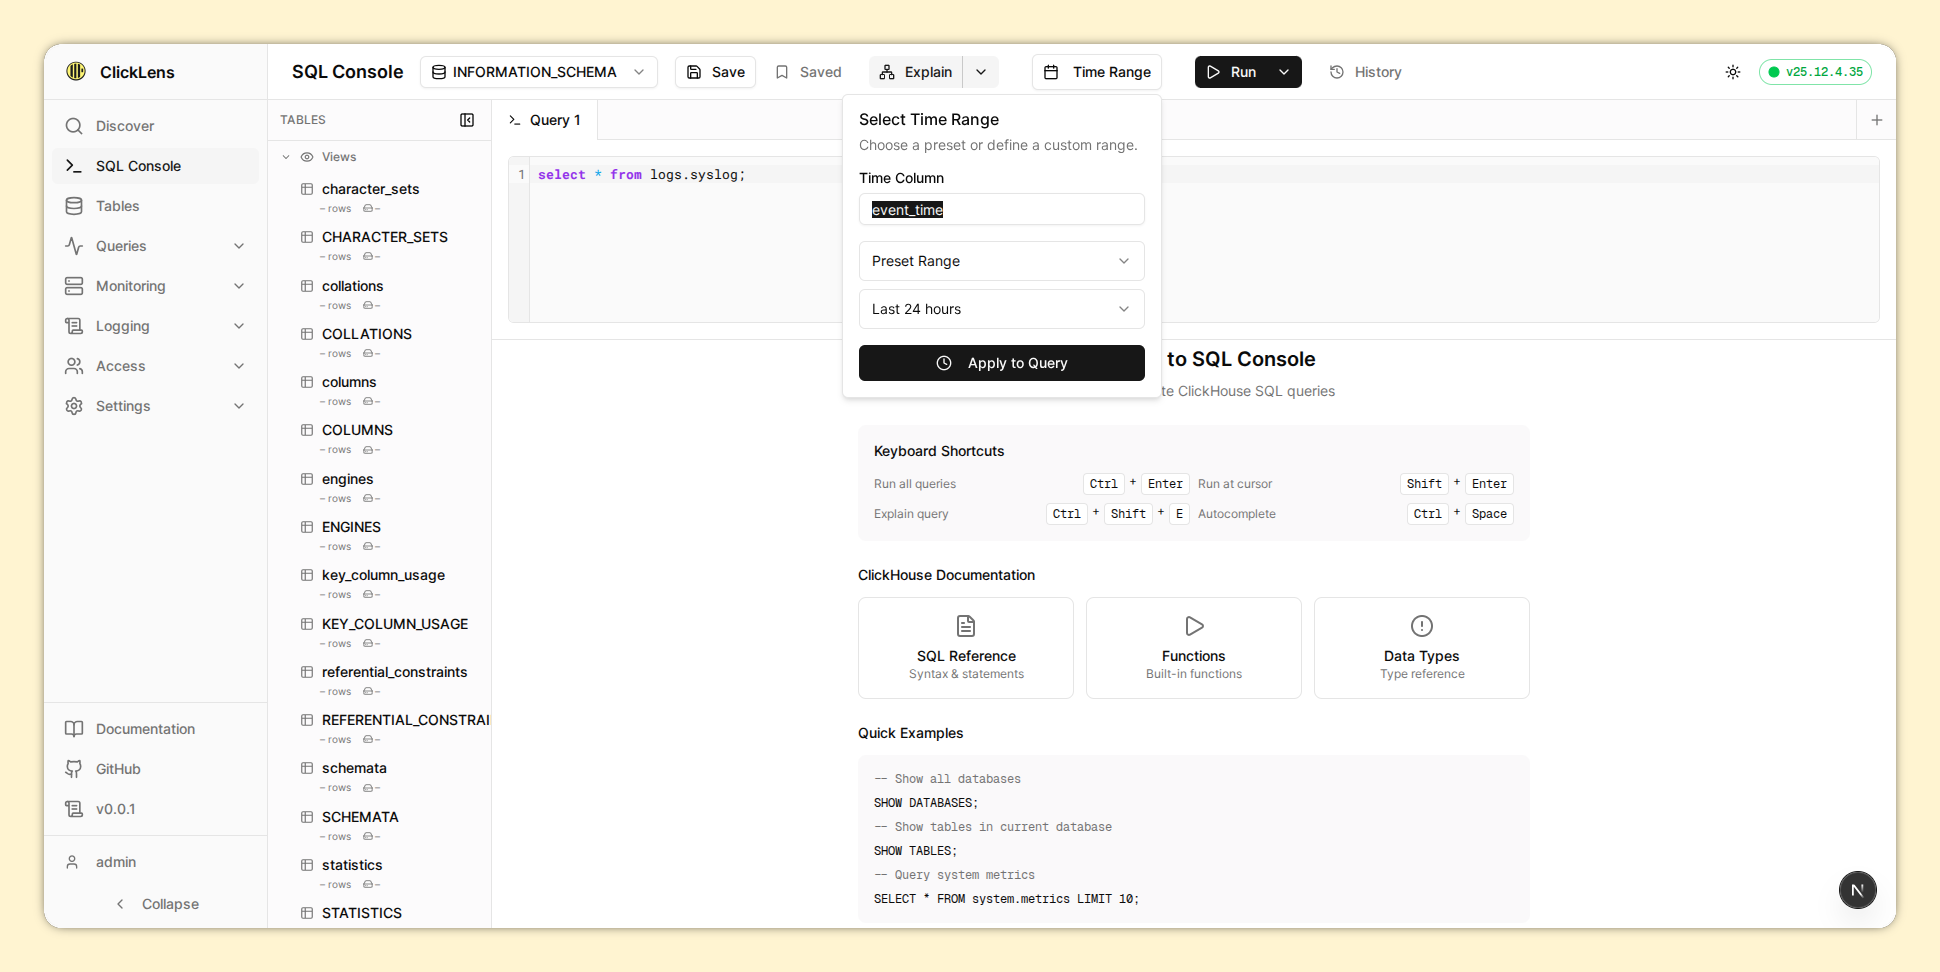
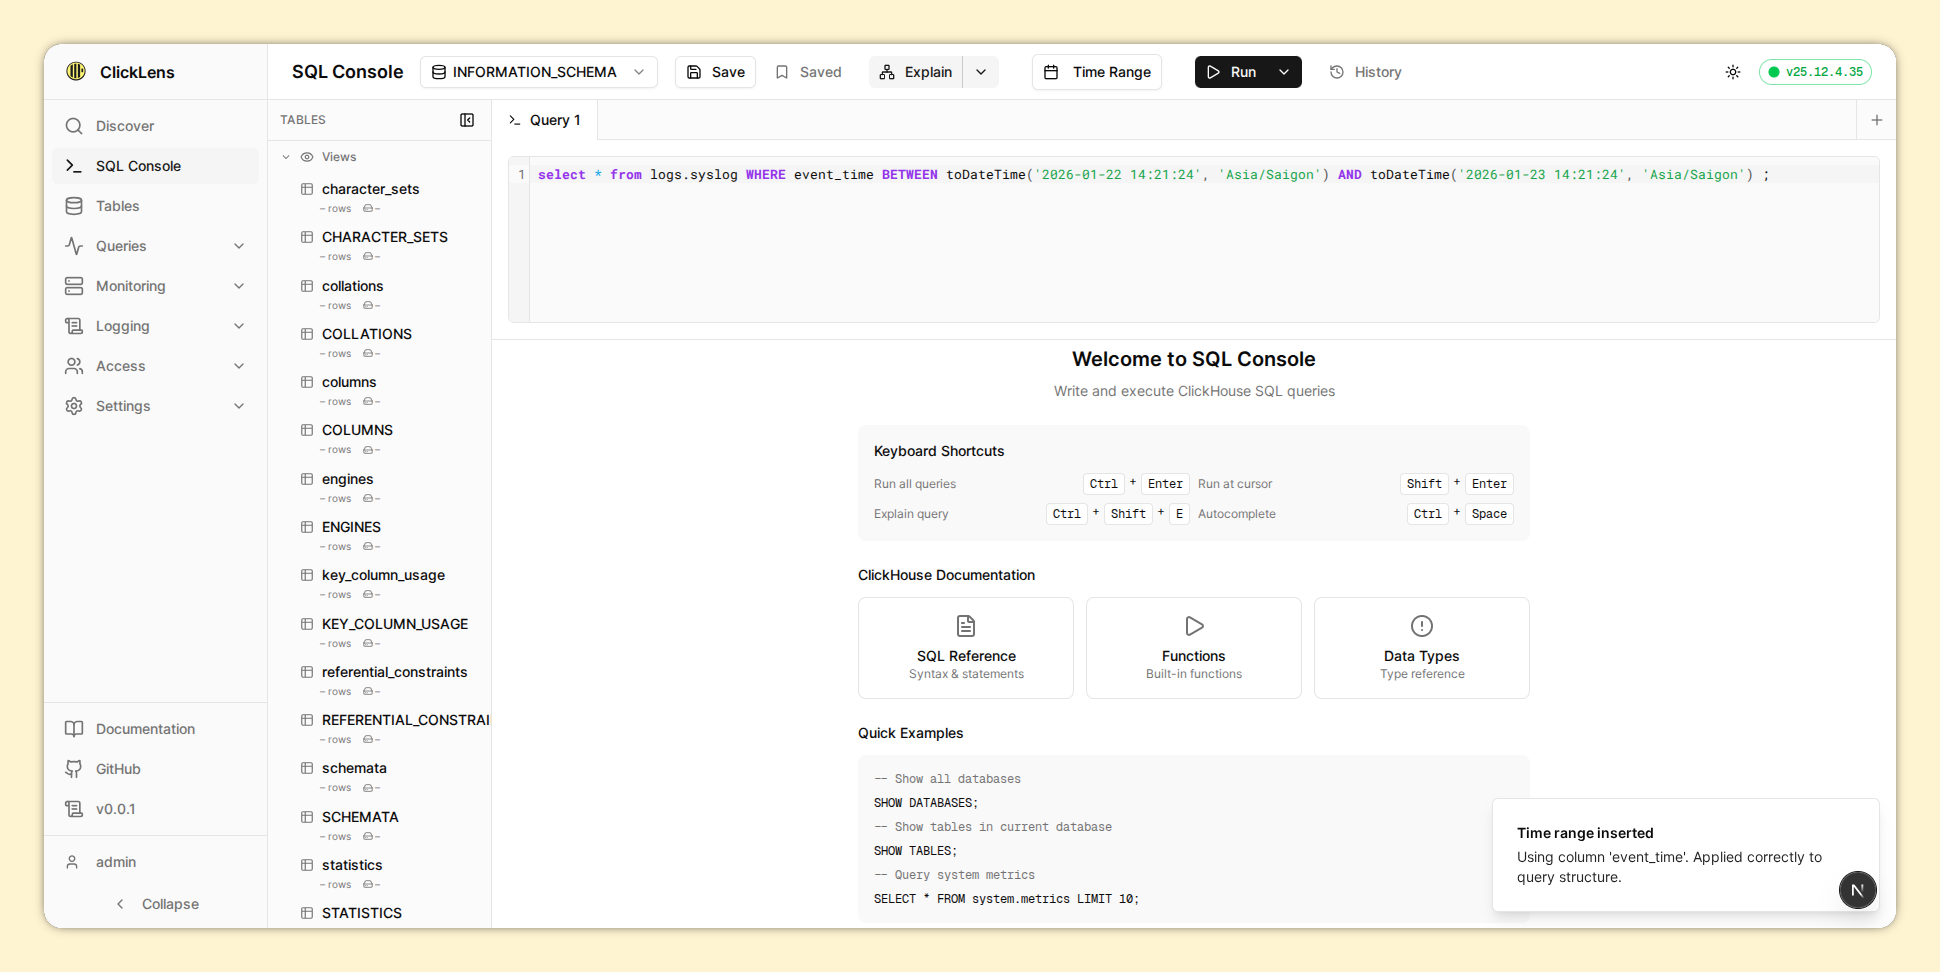
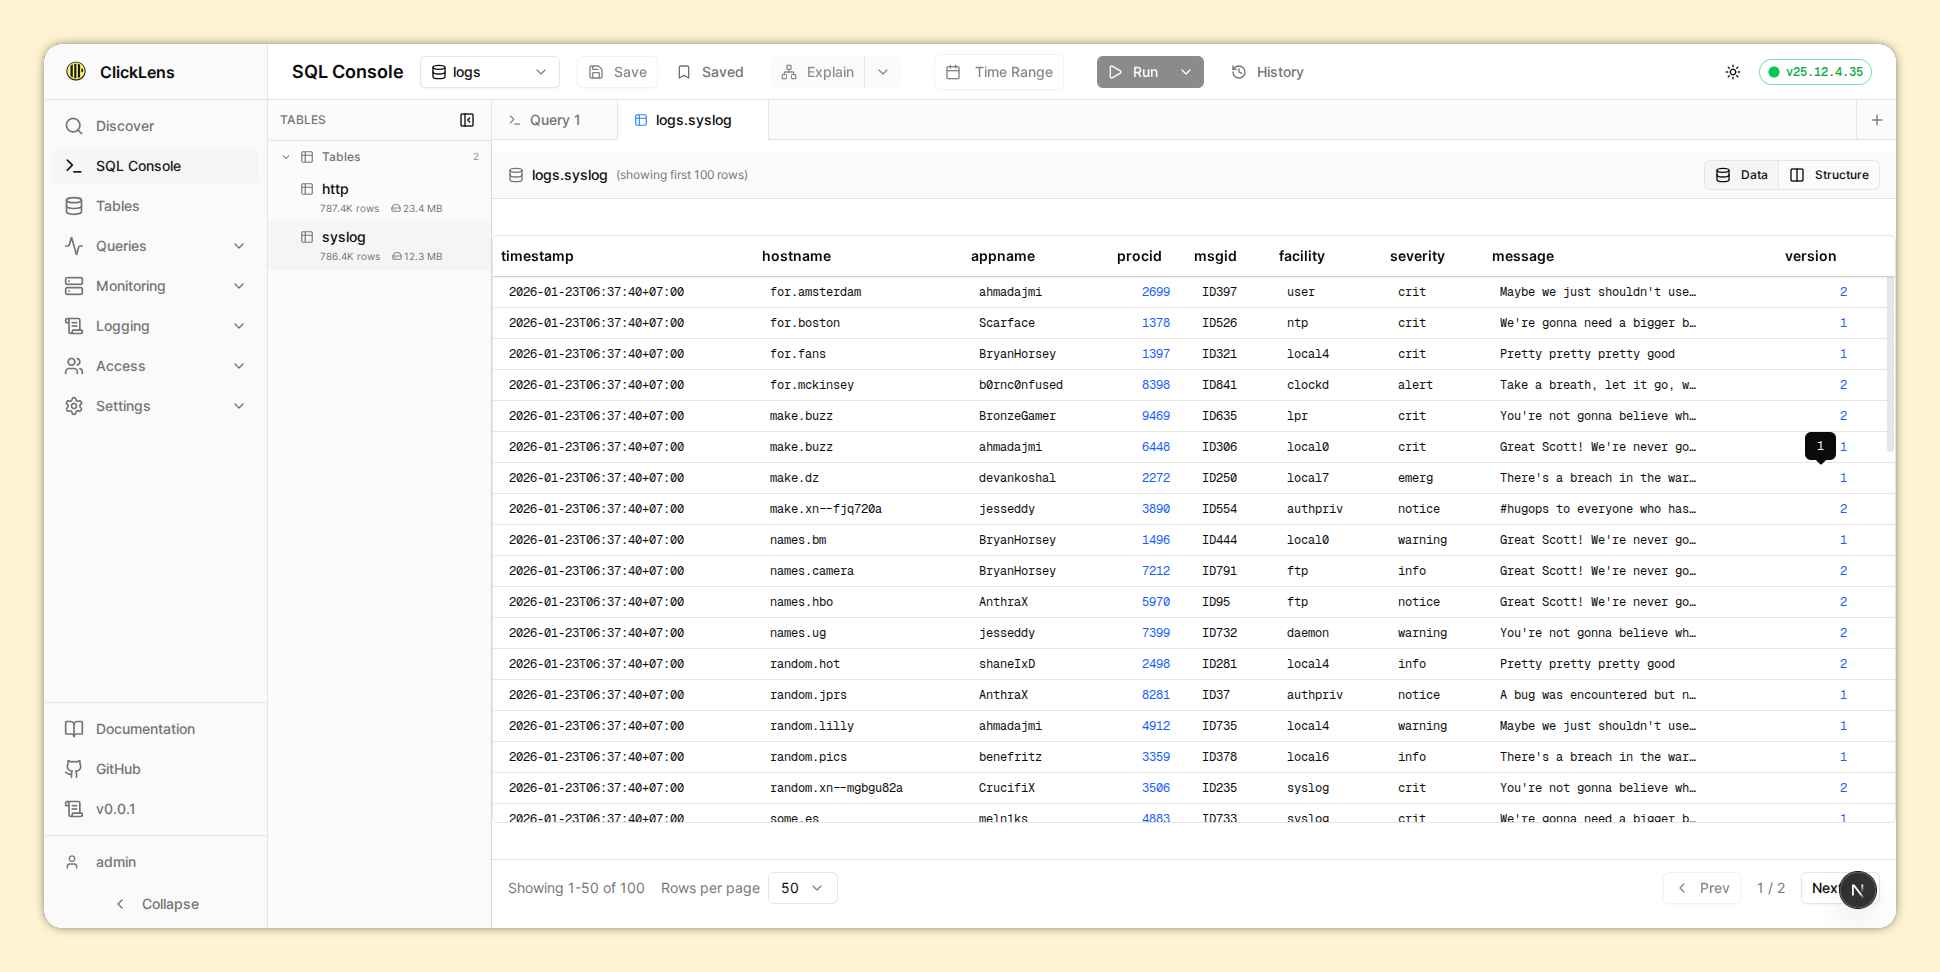
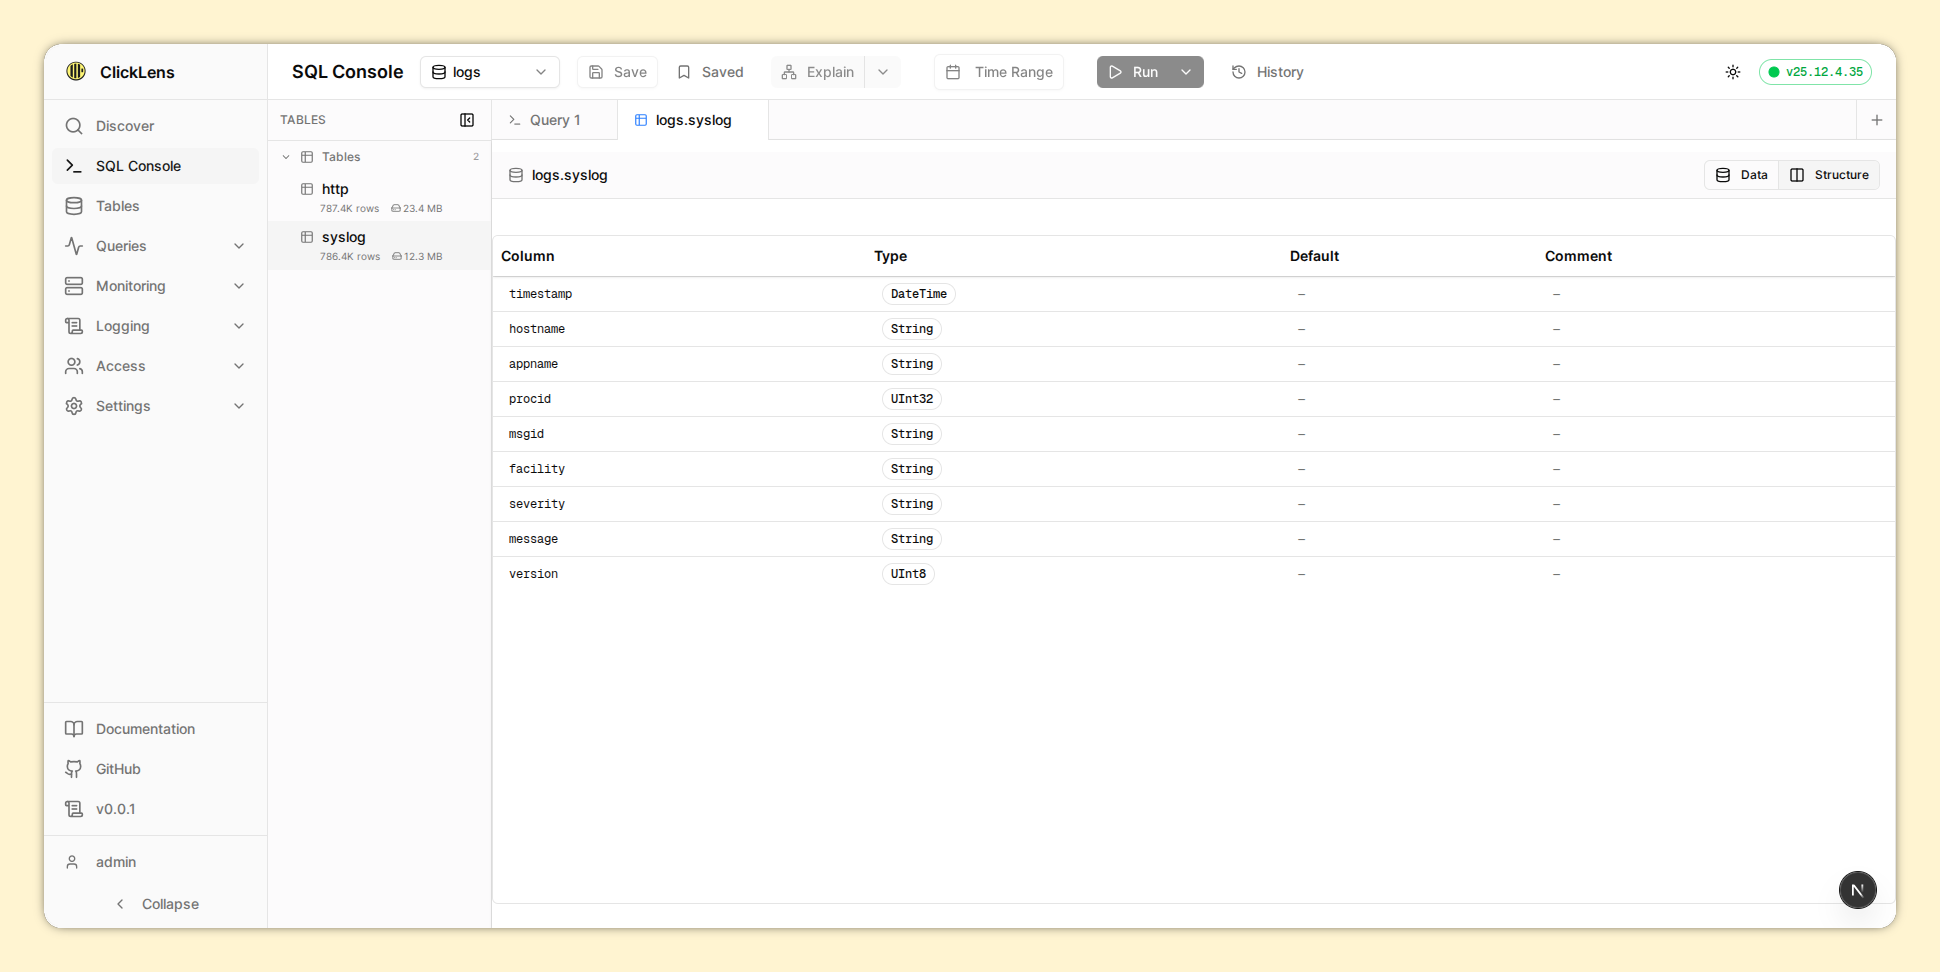
Table Preview
Click the table name in the sidebar to navigate to the table's structure and data (first 100 rows).
2.2. Performance & Security
Performance Optimizations:
- Query timeout enforcement (max 5 minutes)
- NDJSON streaming for large result sets
- Pagination to reduce memory usage
- Metadata caching for table schemas
- Query performance metrics display
Security Features:
- SQL injection protection (blocks dangerous operations)
- Blocks dangerous table functions (file, url, remote, s3, etc.)
- Allows only read operations (SELECT, WITH, SHOW, DESCRIBE, EXPLAIN, etc.)
- Query rate limiting (60 queries per 60 seconds)
- Full RBAC enforcement
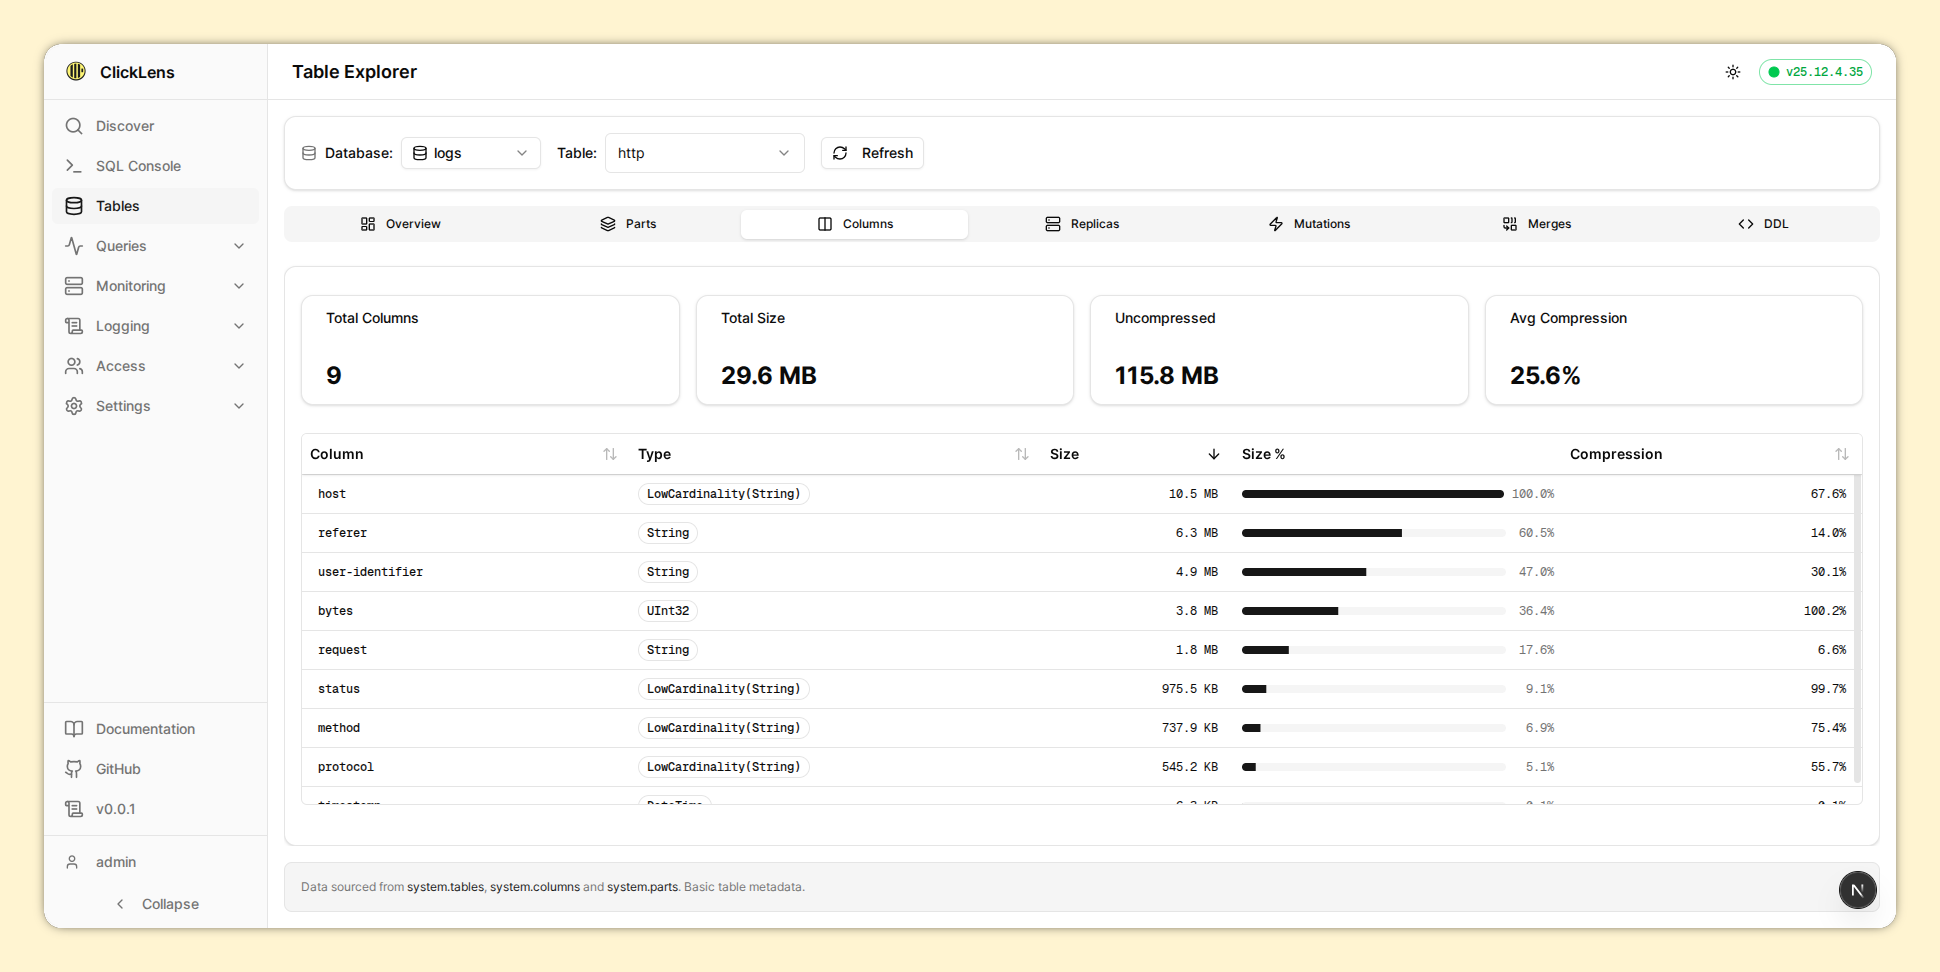
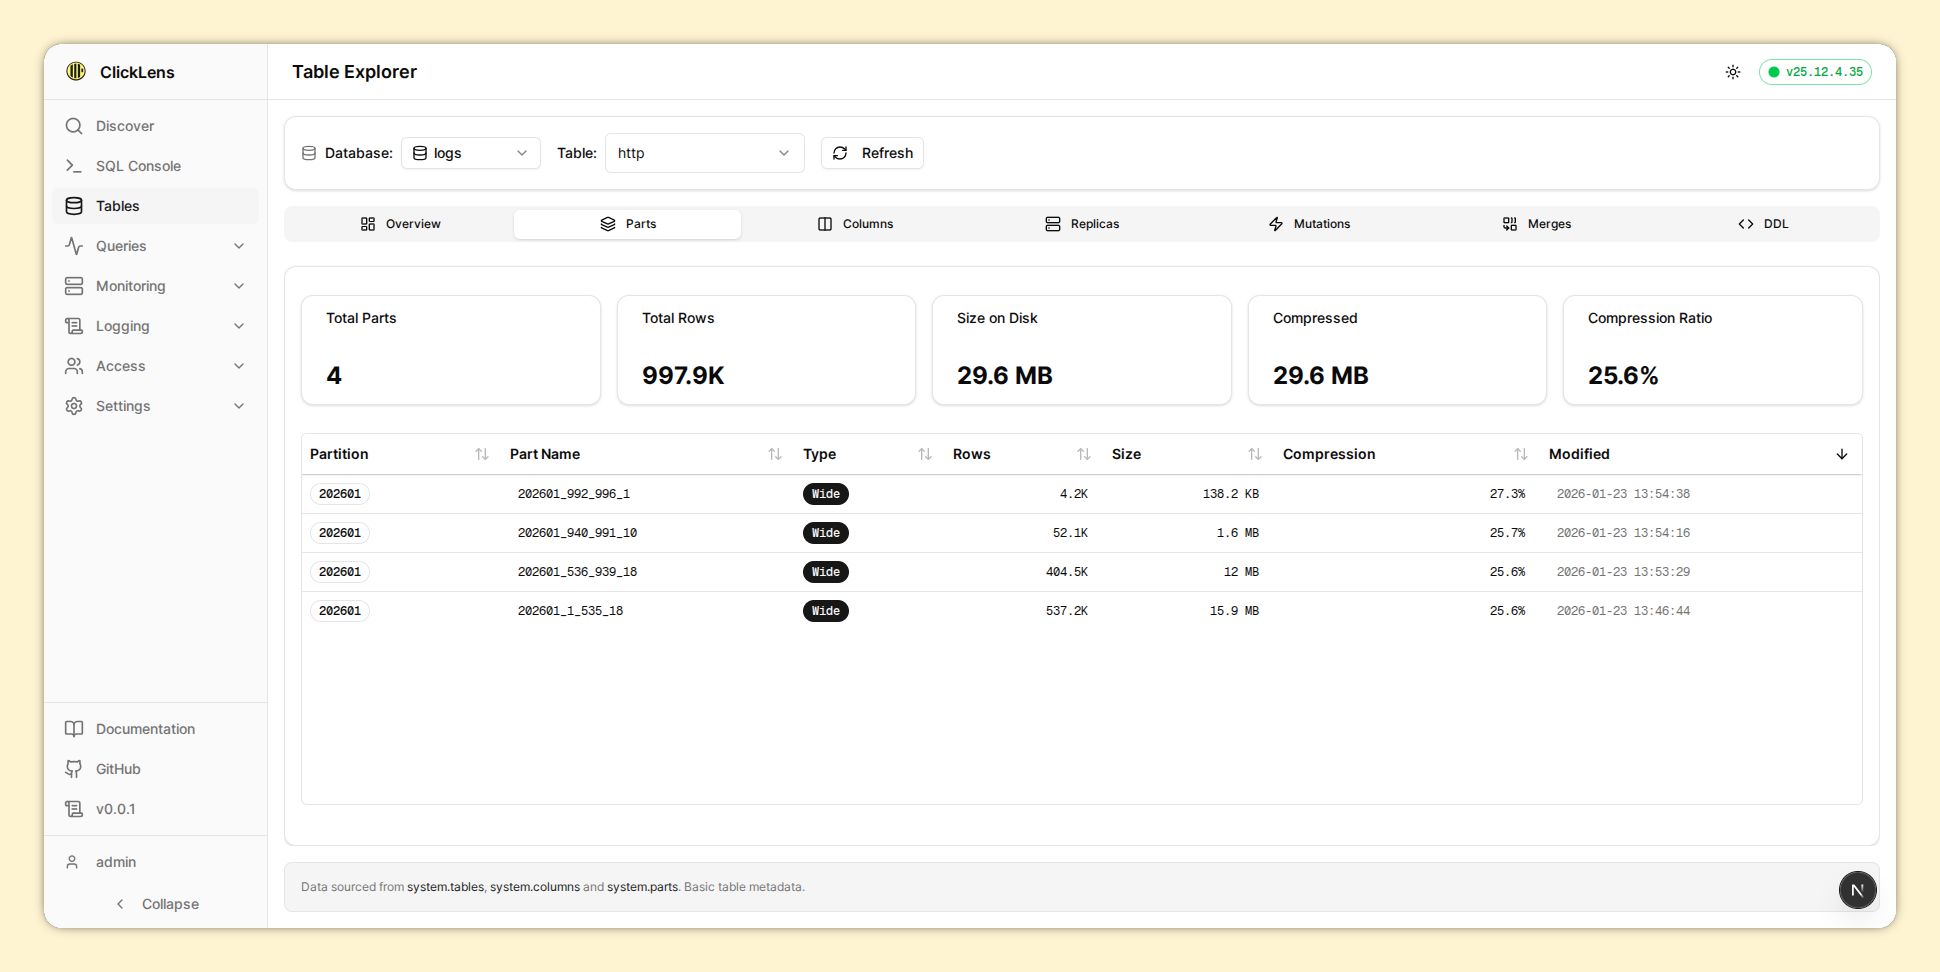
3. Table Explorer
Browse and inspect your ClickHouse schema in detail.
Requires canBrowseTables permission. This is derived from having SHOW TABLES grant.
3.1. Navigation
- Select a database from the left sidebar
- Click a table to view its details
- Use the tabs to explore different aspects
3.2. Table Detail Tabs
| Tab | Description |
|---|---|
| Overview | Summary statistics (rows, size, engine) |
| Columns | Column definitions with types and defaults |
| Parts | Data parts with sizes and row counts |
| Merges | Active merge operations |
| Mutations | Pending ALTER mutations |
| Replicas | Replication status (for replicated tables) |
| Dependencies | Interactive graph of table relationships |
| DDL | CREATE TABLE statement |
3.3. Dependencies Graph
The Dependencies tab visualizes relationships between tables as an interactive graph. This helps understand data flow between tables, especially for:
- Materialized Views - Shows source tables that feed into the view
- Views - Shows tables referenced in the view definition
- Distributed Tables - Shows underlying local tables
Features:
- Interactive Graph: Pan, zoom, and explore the dependency tree
- Visual Node Types: Different colors and icons for table types
- Hierarchical Layout: Source tables appear at the top, dependent tables flow downward
- MiniMap: Navigate large graphs easily
- Connected Highlighting: When a table is selected, its dependencies are highlighted
Only tables with dependencies are shown in the graph. Isolated tables without any relationships are filtered out for clarity.
3.4. Performance Optimizations
- Redis Caching: All table data cached with stale-while-revalidate strategy
- HTTP Caching: Cache-Control headers enable browser and CDN caching
- Metadata Caching: Table schemas and column information cached
- Skeleton Loaders: Smooth loading experience without data flashing
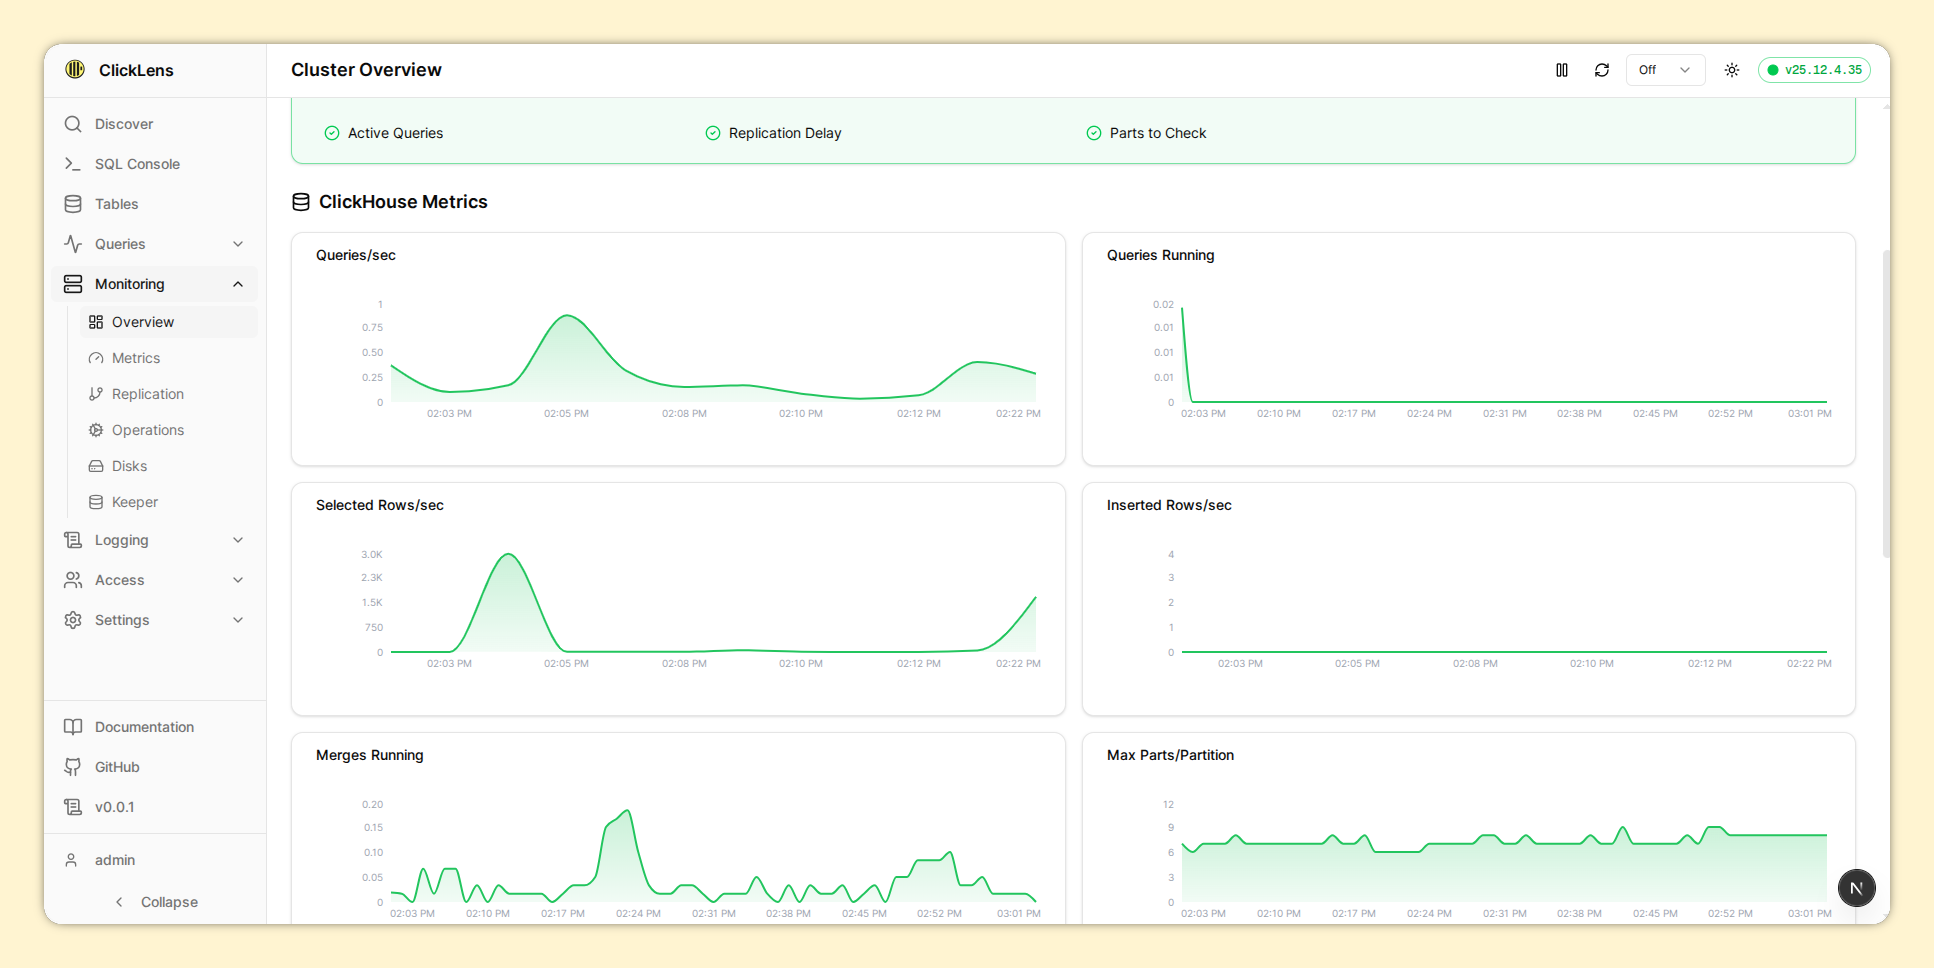
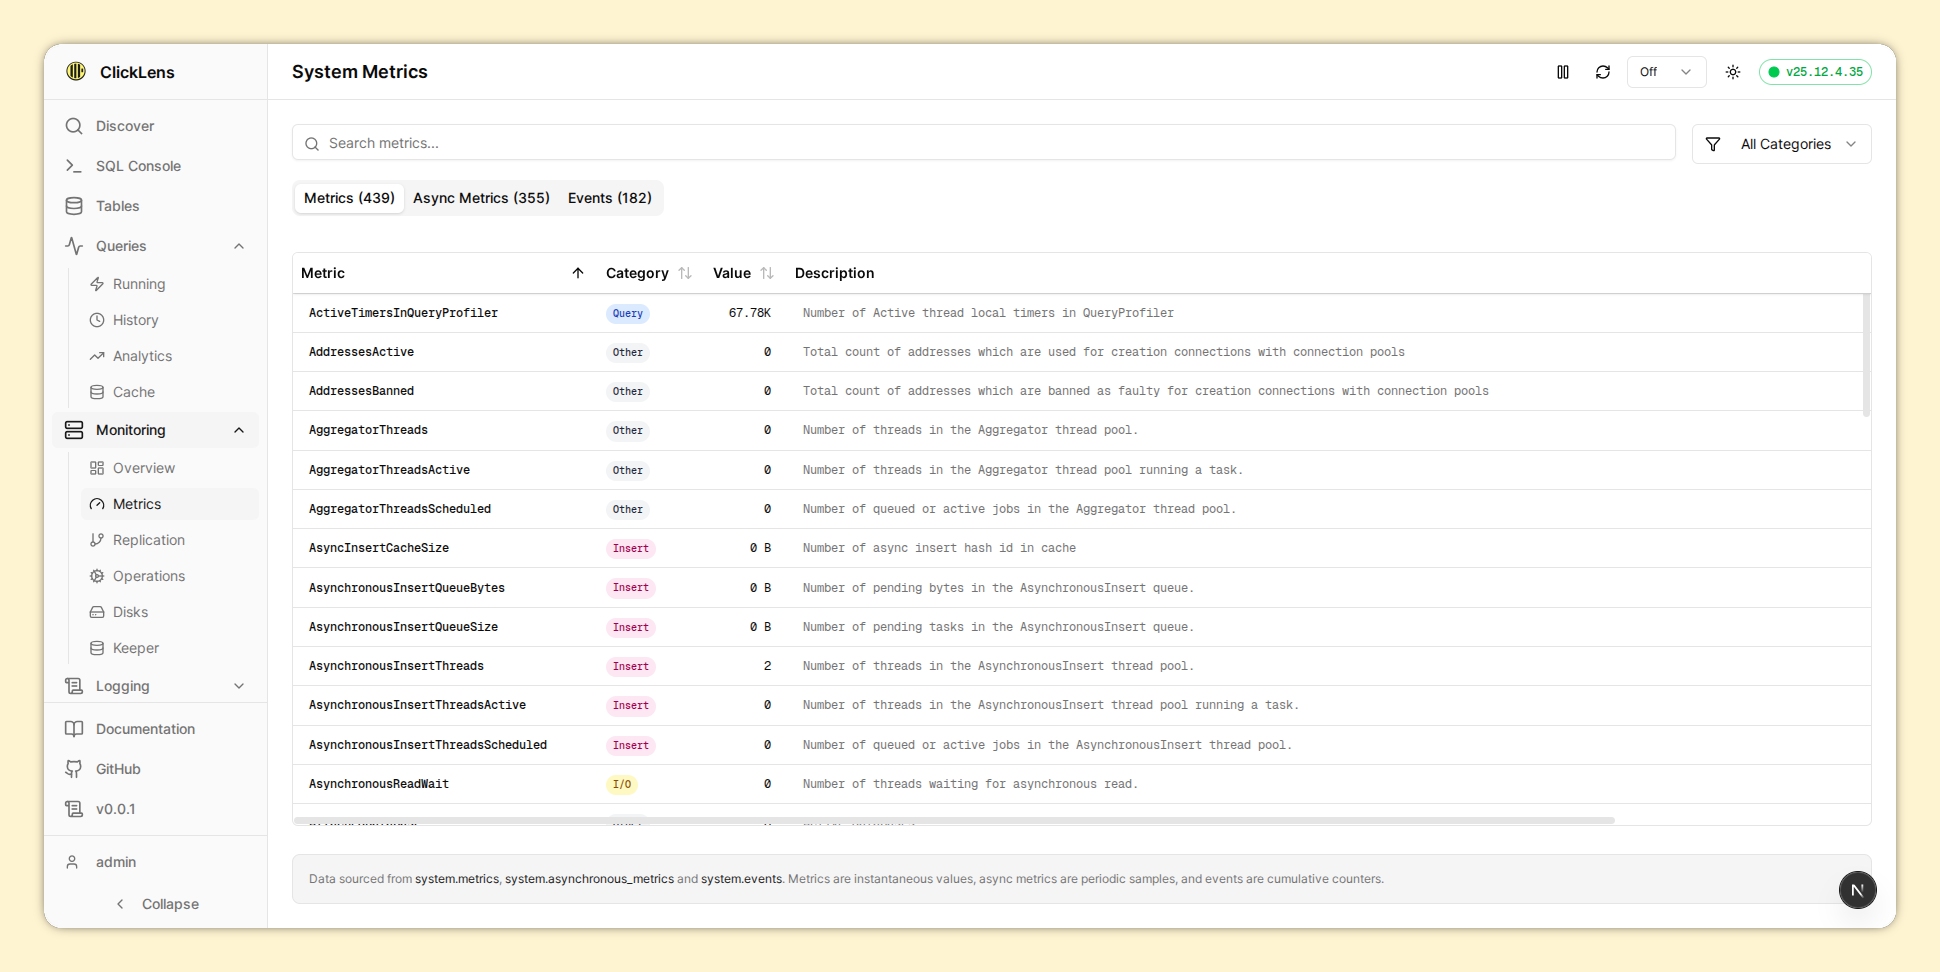
4. Monitoring
Real-time cluster health and performance monitoring.
Requires canViewCluster permission. This is derived from having SELECT
on system cluster tables.
4.1. Available Tabs
| Tab | Route | Description |
|---|---|---|
| Overview | /monitoring/overview | Dashboard with key metrics |
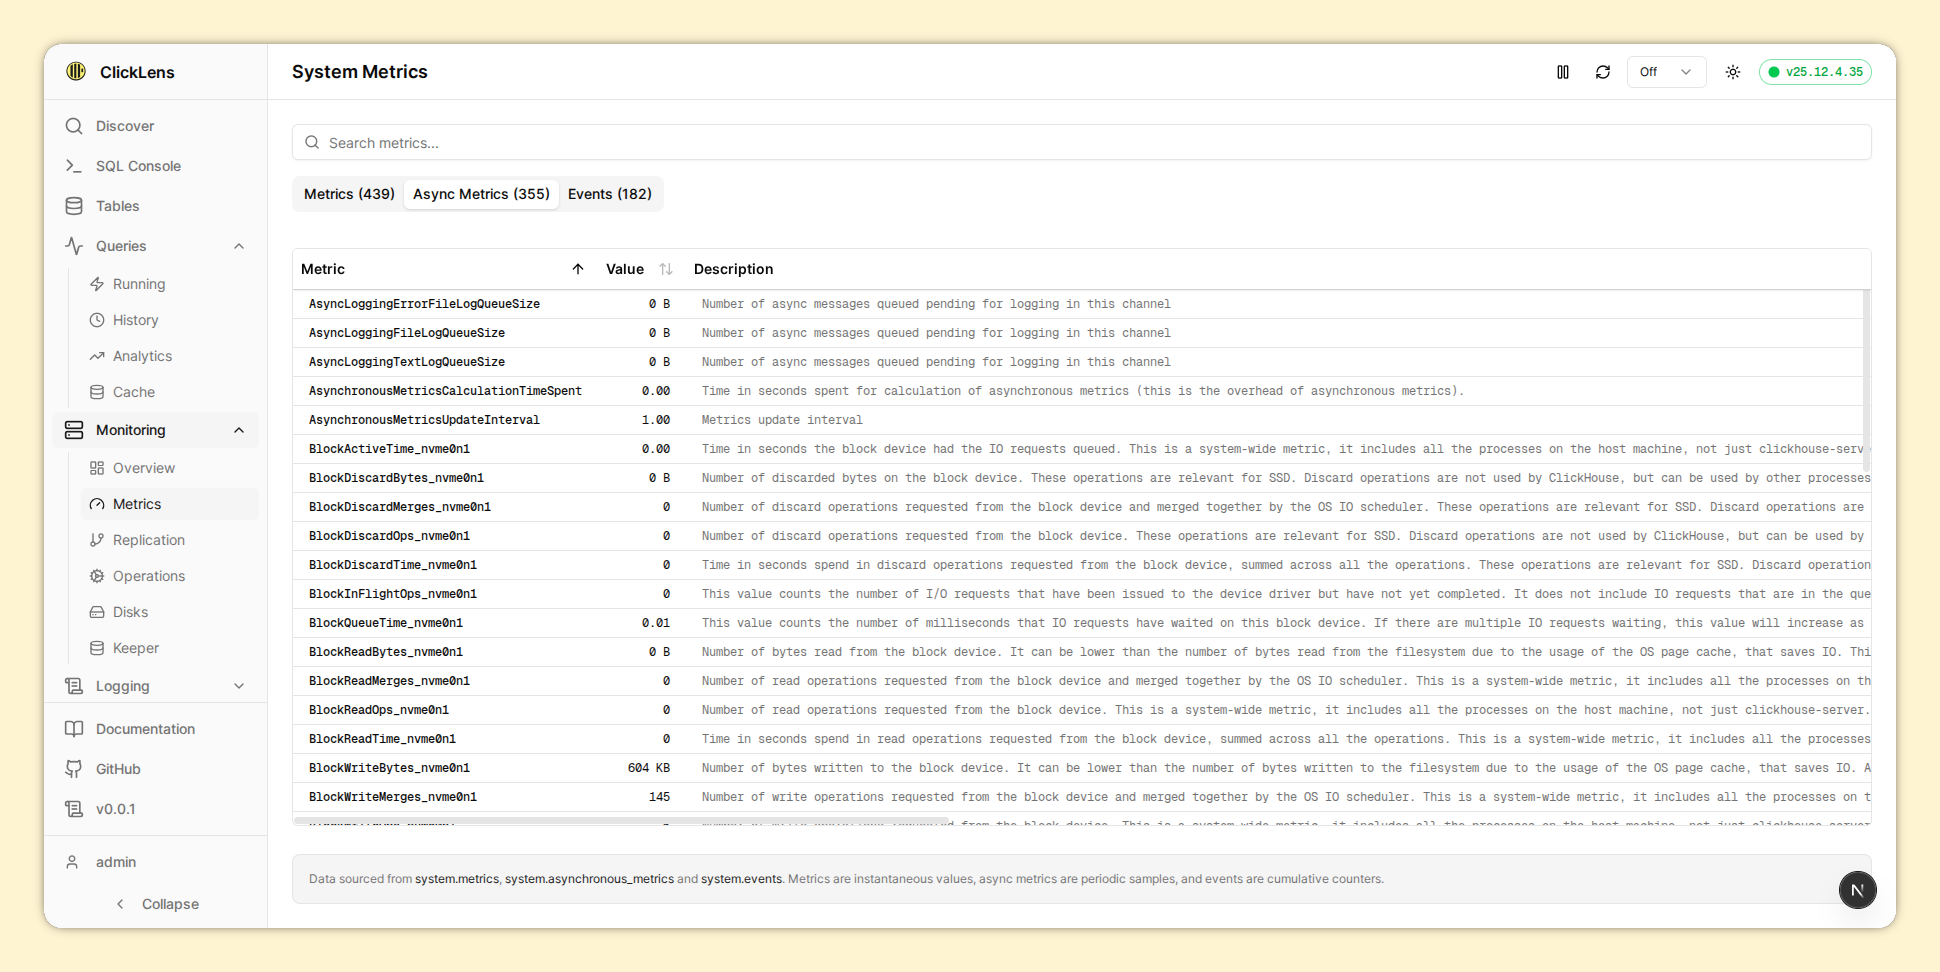
| Metrics | /monitoring/metrics | Browse system.metrics |
| Cluster | /monitoring/cluster | Cluster topology and nodes |
| Health | /monitoring/health | Health check status |
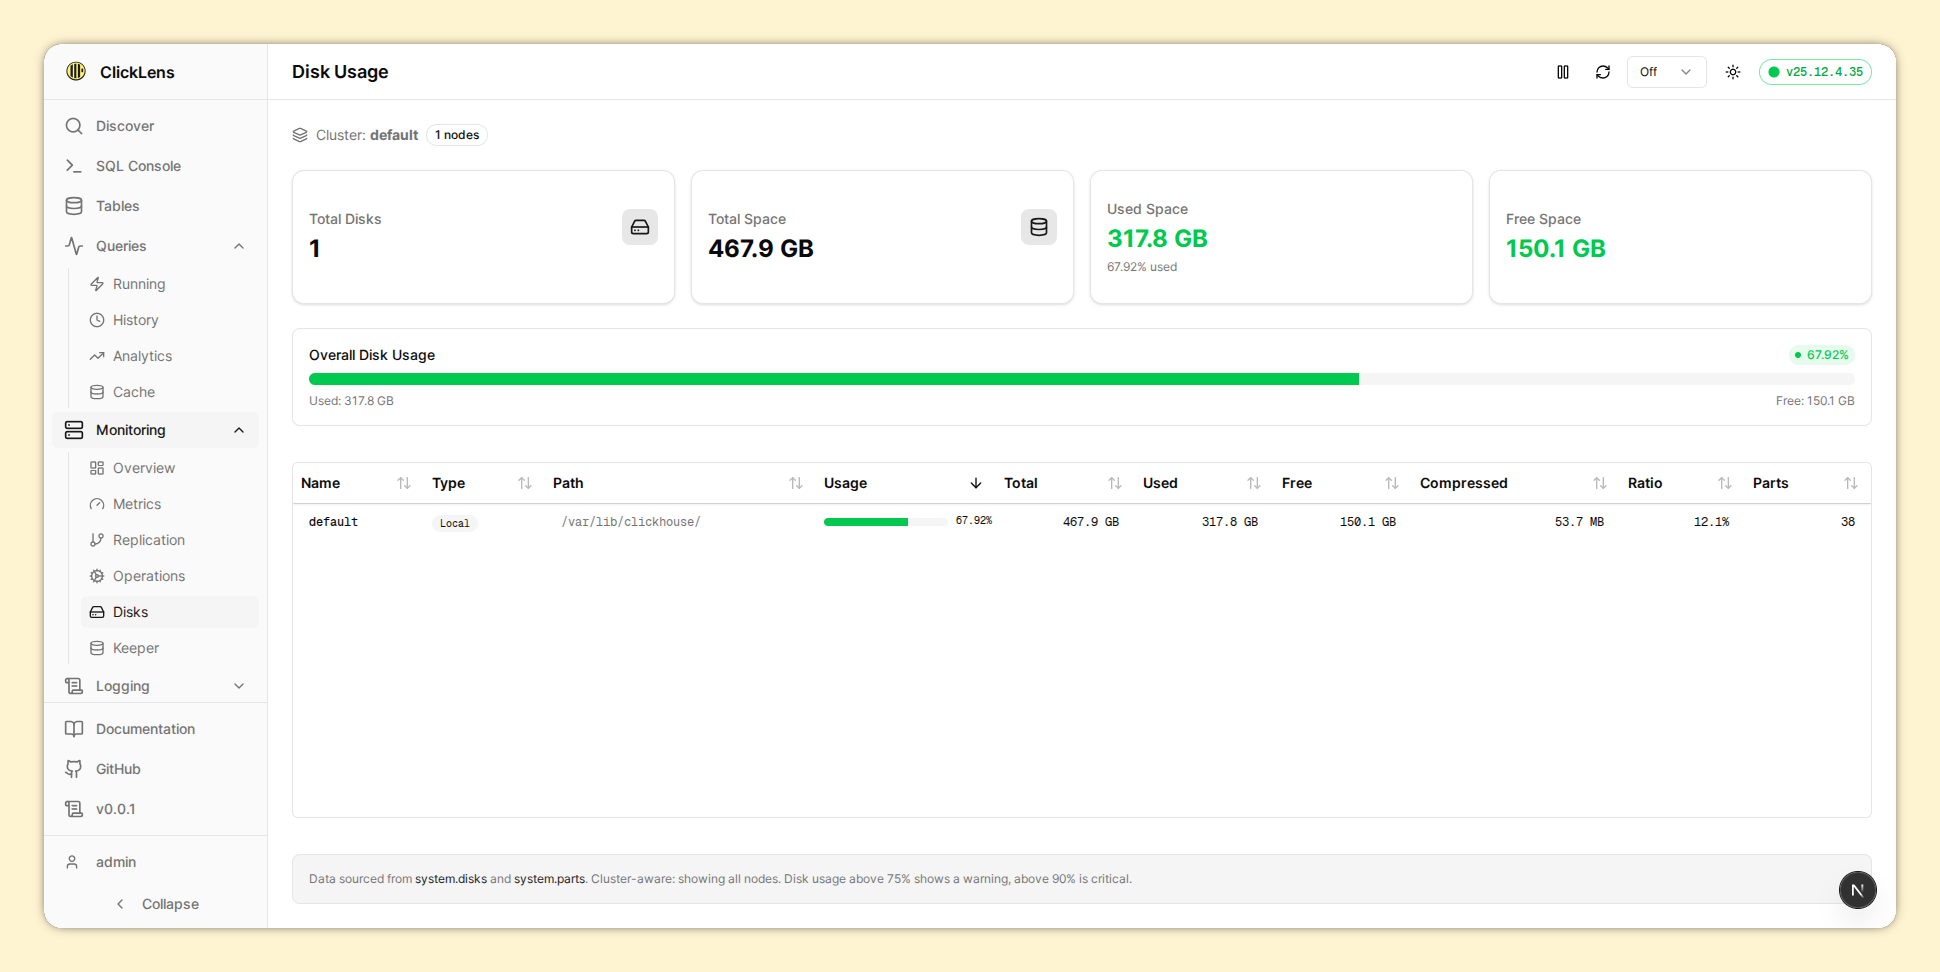
| Disks | /monitoring/disks | Disk usage and capacity |
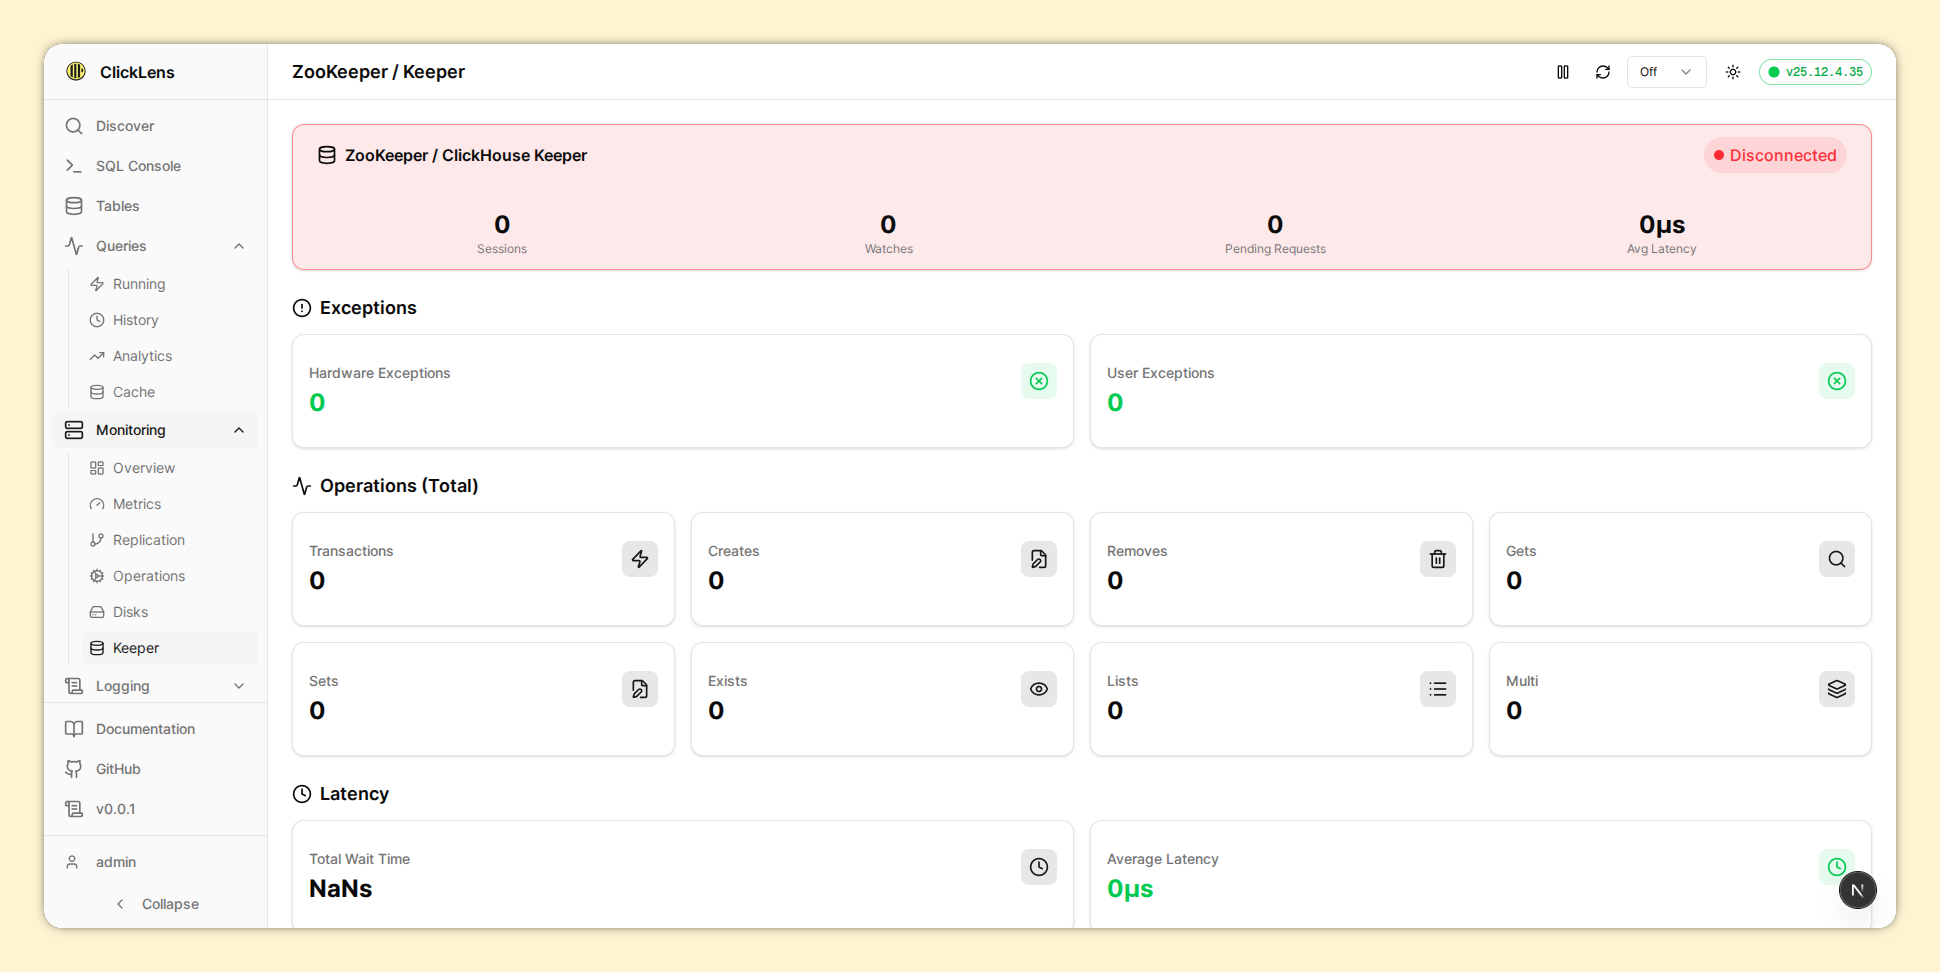
| Keeper | /monitoring/keeper | ClickHouse Keeper status |
| Operations | /monitoring/operations | Active merges and mutations |
| Replication | /monitoring/replication | Replication queue status |
- Cluster Status: Shows the number of shards, replicas, and cluster name
- Health Checks: Uptime, readonly replicas, parts to check, max parts per partition, active queries, memory usage, and replication delay
- Multiple Graphs: Based on ClickHouse built-in monitoring dashboards, grouped into ClickHouse Metrics, System Health, and Network Metrics
Because the demo cluster does not include ClickHouse Keeper/ZooKeeper, the screenshots show errors. This is expected behavior.
4.2. Performance Optimizations
- Redis Caching: All monitoring metrics cached with stale-while-revalidate
- HTTP Caching: Cache-Control headers enable browser and CDN caching
- Skeleton Loaders: Smooth loading experience without data flashing
- Efficient Queries: Optimized queries for system tables to minimize overhead
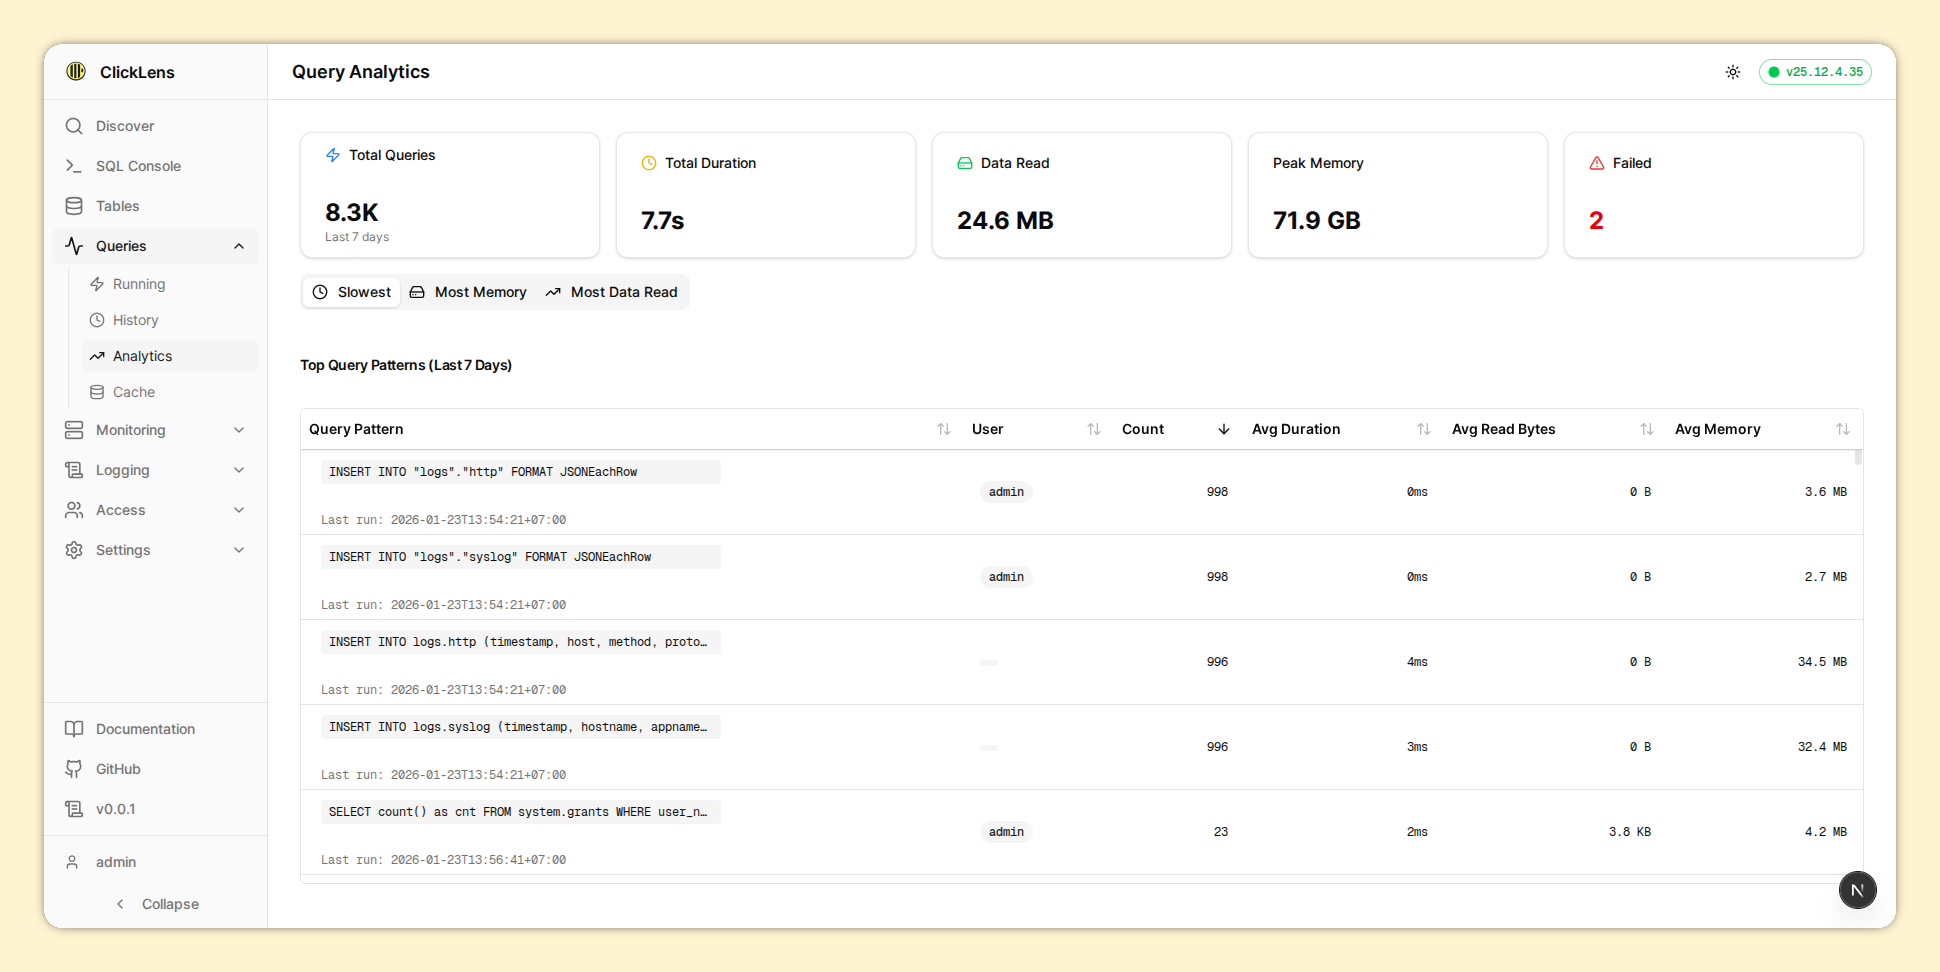
5. Query Analytics
Analyze query performance and identify slow queries.
Requires canViewProcesses permission. This is derived from having
SELECT on system.processes.
5.1. Available Views
| View | Route | Description |
|---|---|---|
| Running | /queries/running | Currently executing queries |
| History | /queries/history | Historical query log from system.query_log |
| Analytics | /queries/analytics | Top resource-consuming queries |
| Cache | /queries/cache | Query cache statistics |
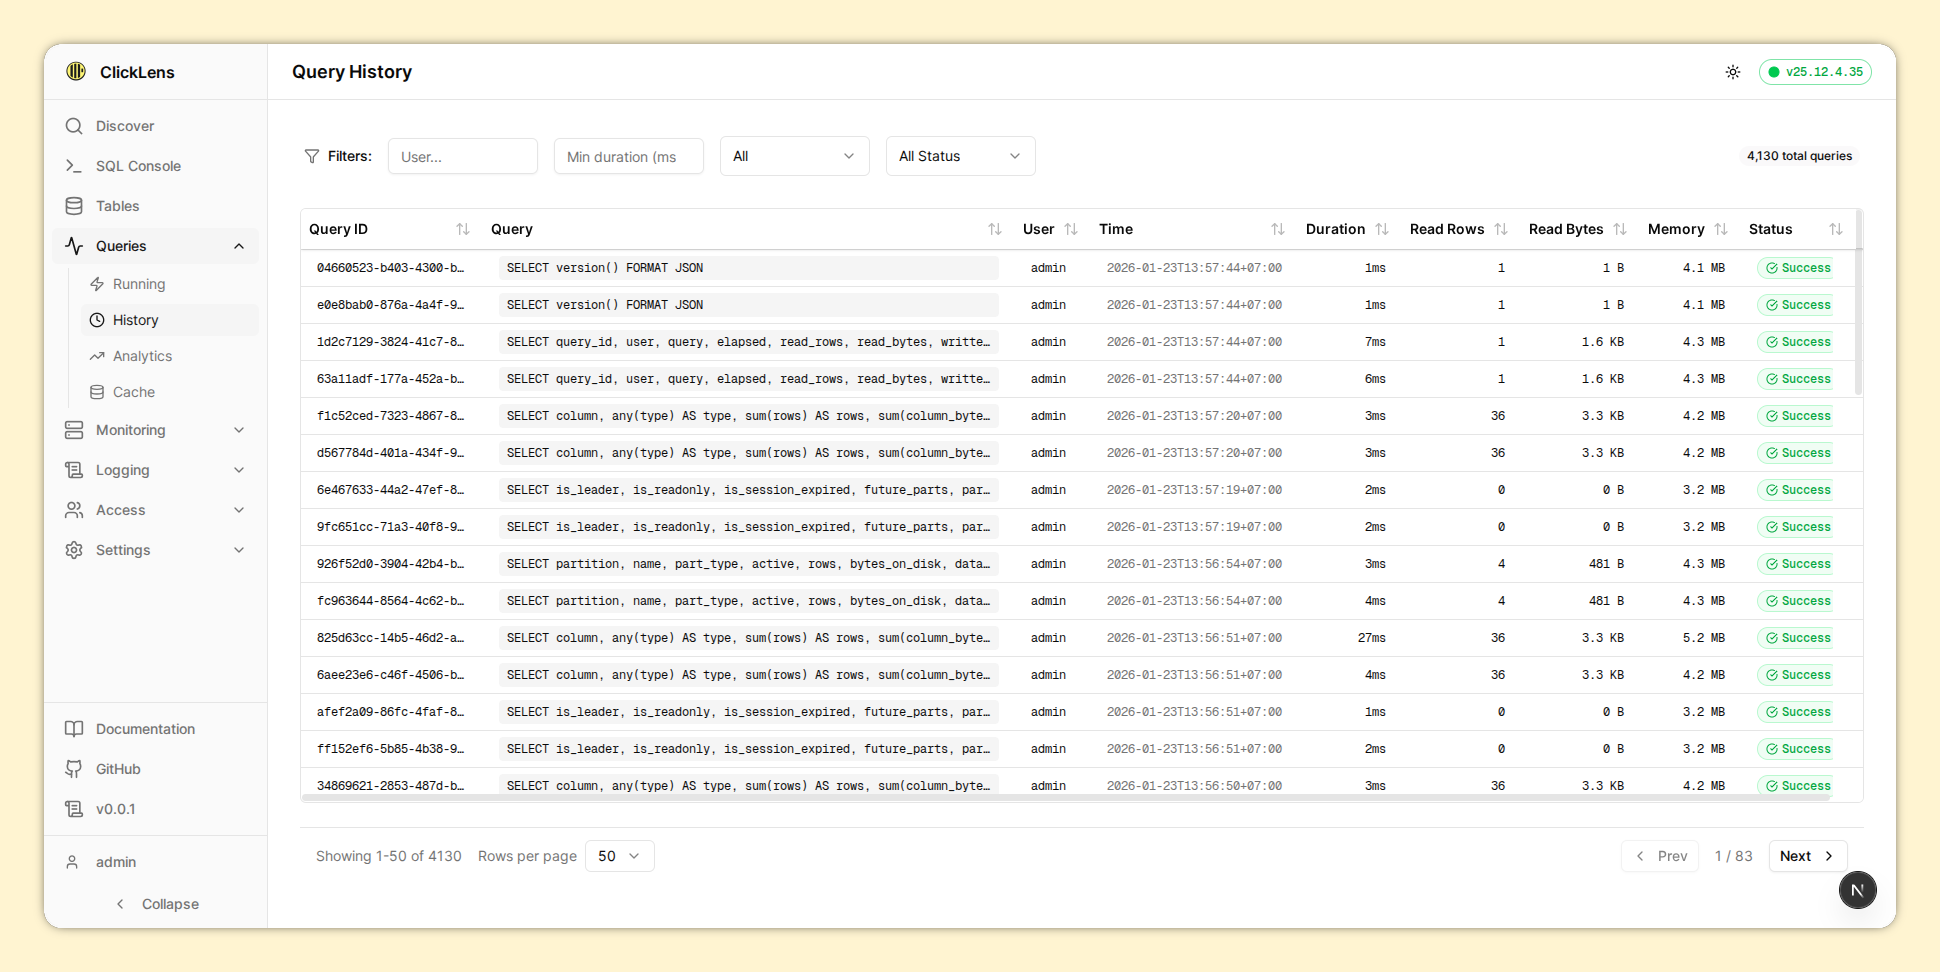
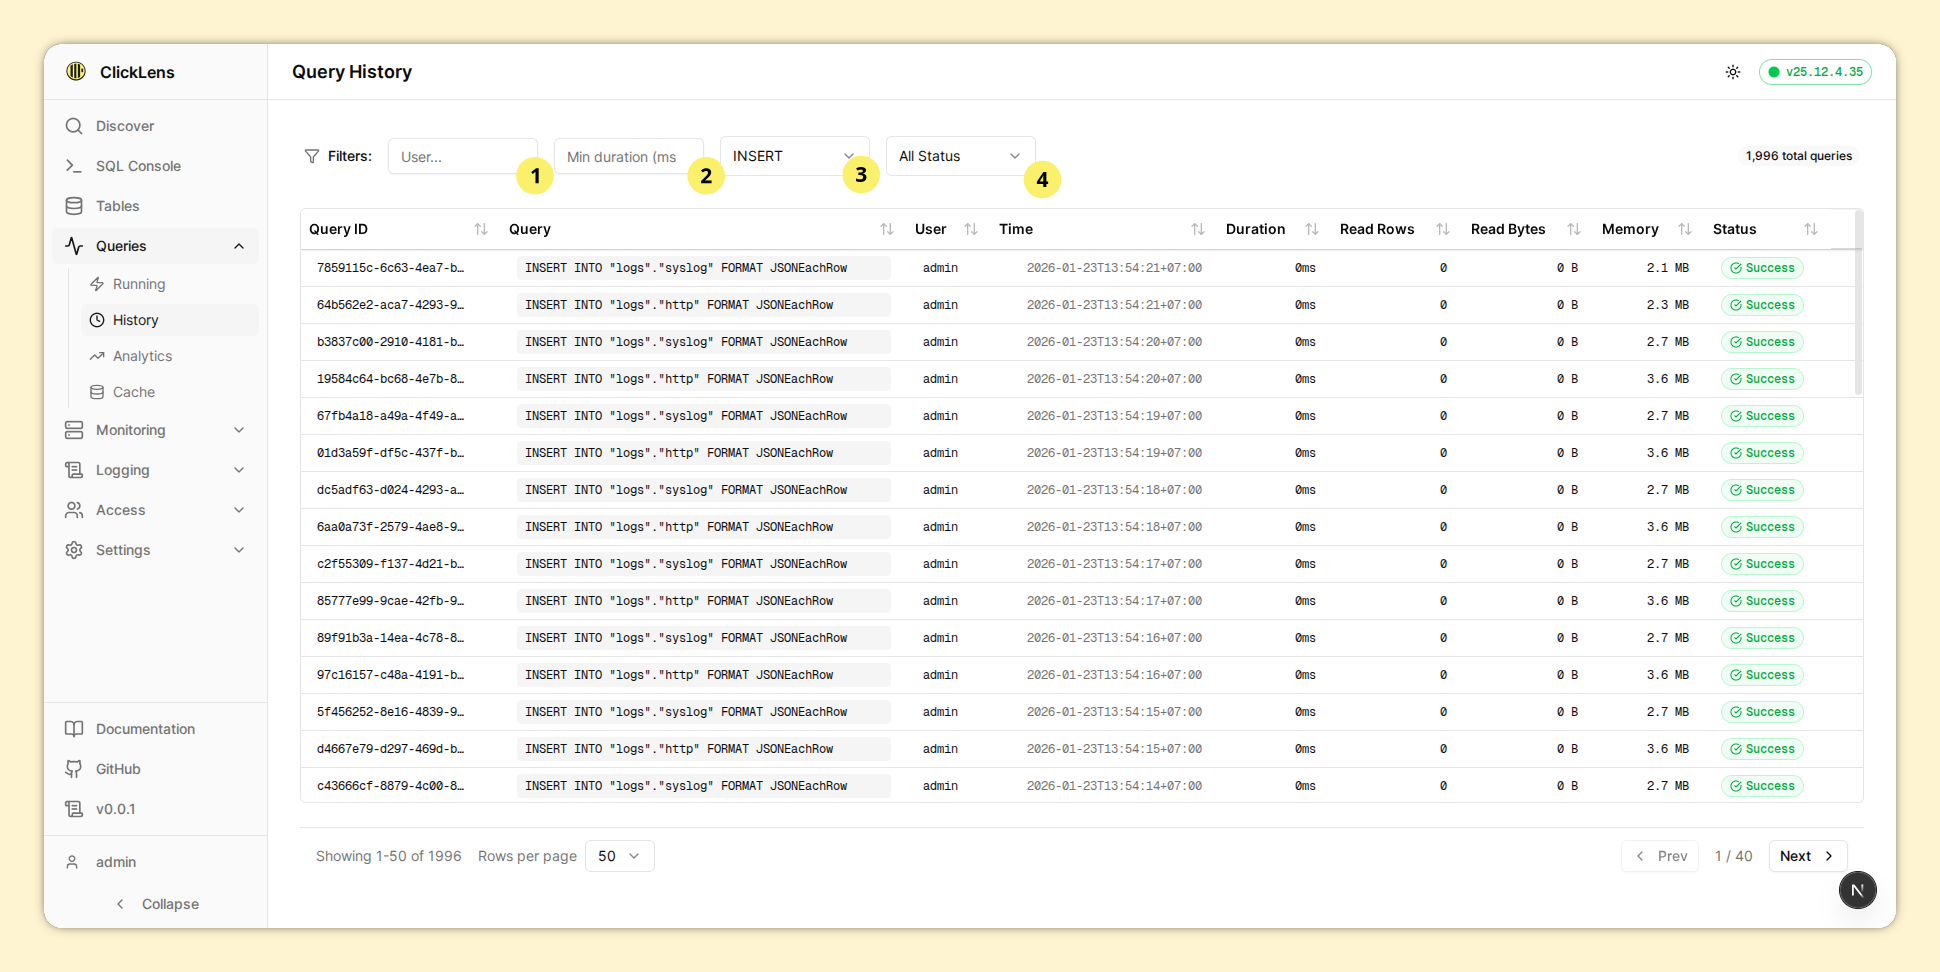
- Filter by user: Filters queries executed by a specific user
- Filter by execution duration: Enter a minimum duration to show only queries that took longer
- Filter by query type: Filter by query type (INSERT, CREATE, SELECT, ALTER, DROP)
- Filter by status: Filter by execution status ('Success' or 'Error')
5.2. Query Cancellation
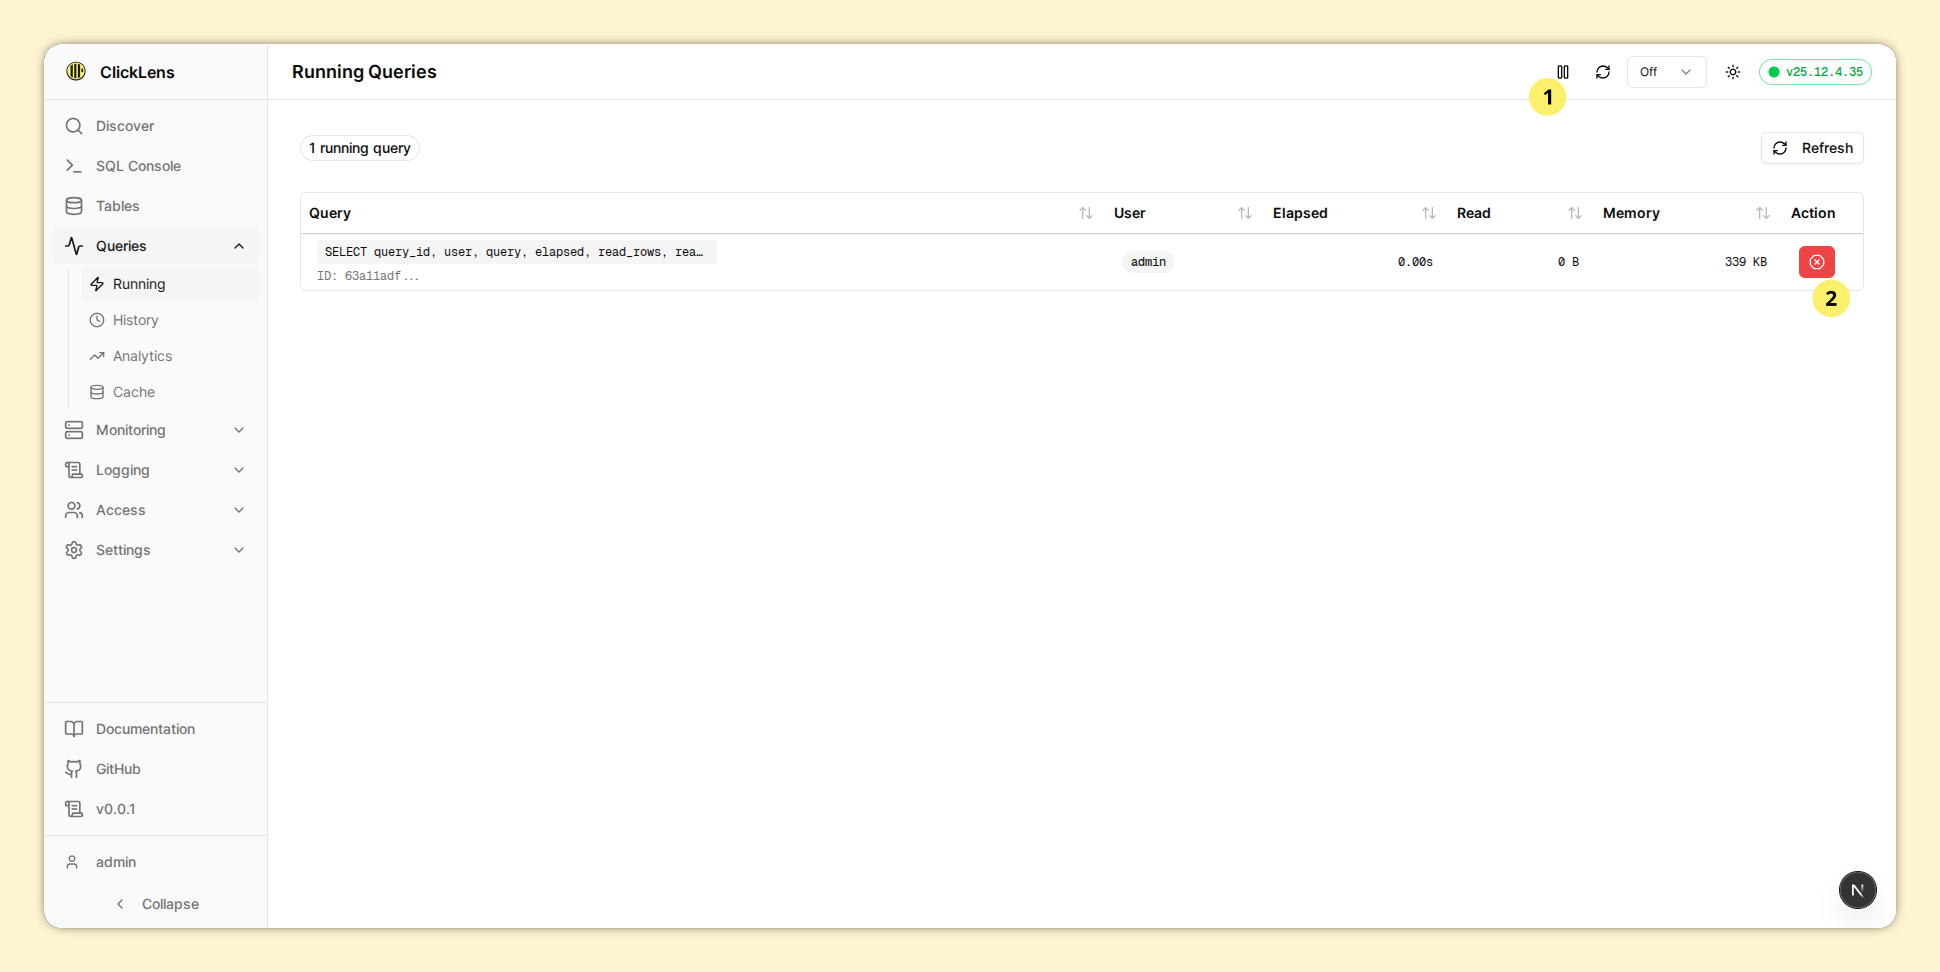
- Refresh Control: Control the refresh behavior (similar to Grafana and Kibana)
- Kill action: Kill queries using the KILL QUERY command (requires
canKillQueriespermission)
6. Logging
View and search through ClickHouse logs.
Different log types require different permissions.
| Log Type | Route | Required Permission |
|---|---|---|
| Server Logs | /logging/server | canViewServerLogs |
| Session Logs | /logging/session | canViewSessionLogs |
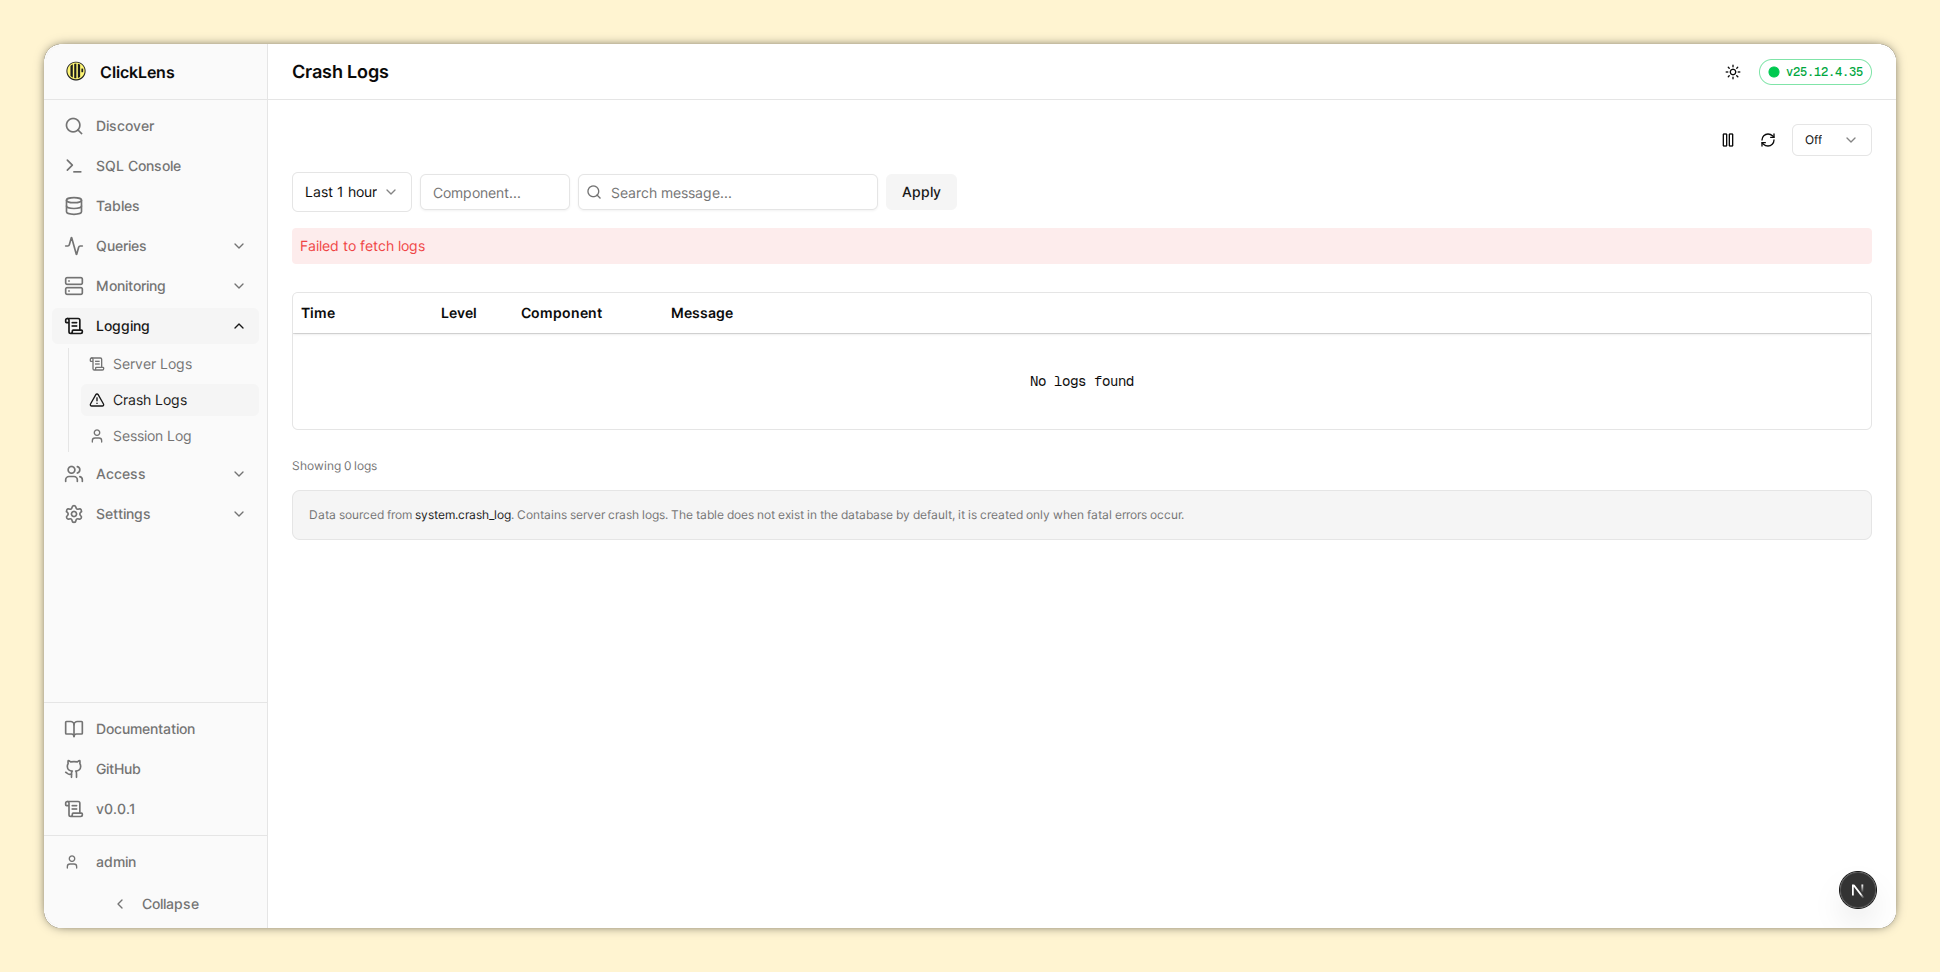
| Crash Logs | /logging/crash | canViewCrashLogs |
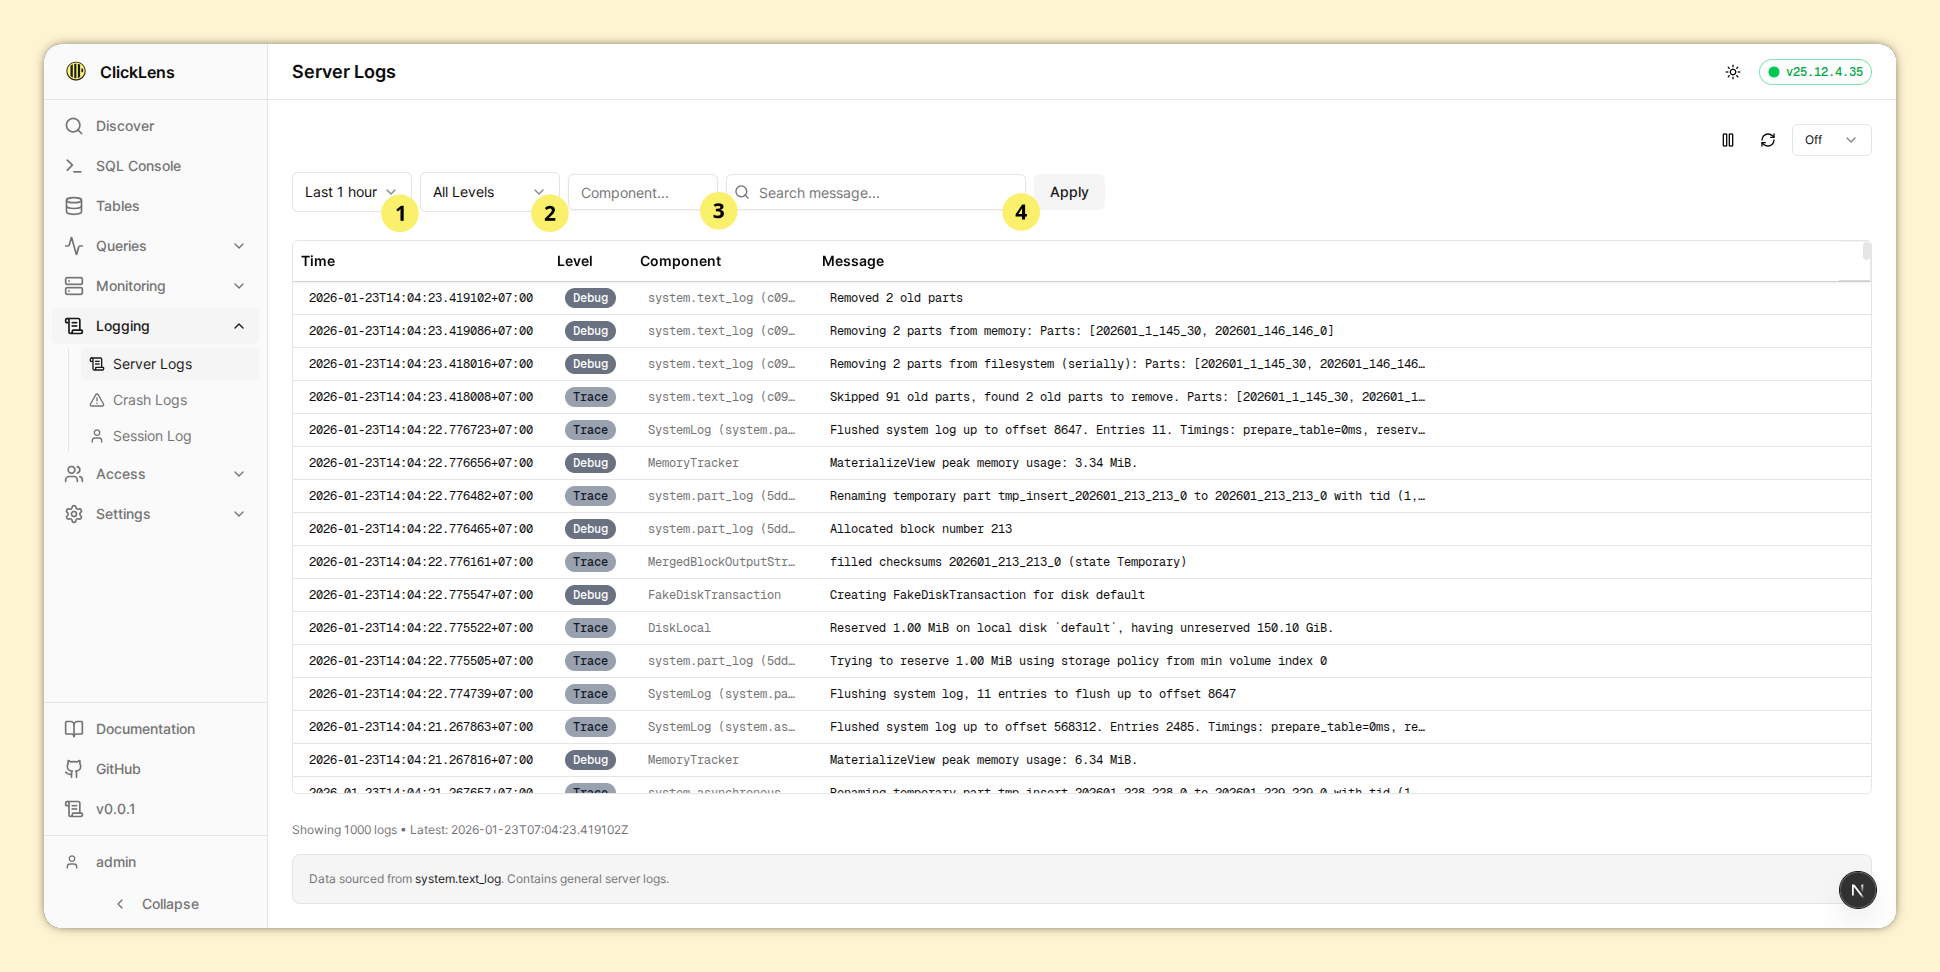
- Time range: Select the time range for logs
- Filter by log level: Filter to show only specific log levels (e.g., ERROR)
- Filter by component: Enter a component name to filter logs
- Filter by message: Enter part of a message to search (uses
WHERE LIKE '%string%') - Live Mode: Auto-refresh uses efficient streaming to prepend only new logs
The system.crash_log table does not exist in the database by default, it is created only when fatal errors occur.
7. Access Control
Manage ClickHouse users and roles.
Requires canManageUsers permission. This is derived from having ACCESS MANAGEMENT grant.
7.1. RBAC Overview
In ClickHouse, Access control management is supported via RBAC approach. The entities that are part of ClickHouse RBAC are:
- User Account – Identifies individual end users or applications that connect and access data in ClickHouse
- Role – Roles hold the information about privileges, settings, and constraints for the users
- Settings profile – Group of settings that will be applied to the user or a role
- Quotas – Limit the resource usage for a role or user over a period of time
ClickLens enforces a strict RBAC approach to ensure consistency and the Principle of Least Privilege:
- Grant only roles to users
- Grant privileges and settings profiles to roles
The principle of least privilege is an information security concept that states that every entity must be able to access only the information and resources that are necessary for completing the required task.
XML-Configured Users (e.g., default user): Some users receive access via
users.xml instead of SQL grants. Since these privileges don't appear in
system.grants, ClickLens intelligently falls back to user-credential probes
(running SHOW GRANTS and probing system.tables with the user's
credentials) to accurately determine access.
7.2. Available Views
| View | Route | Description |
|---|---|---|
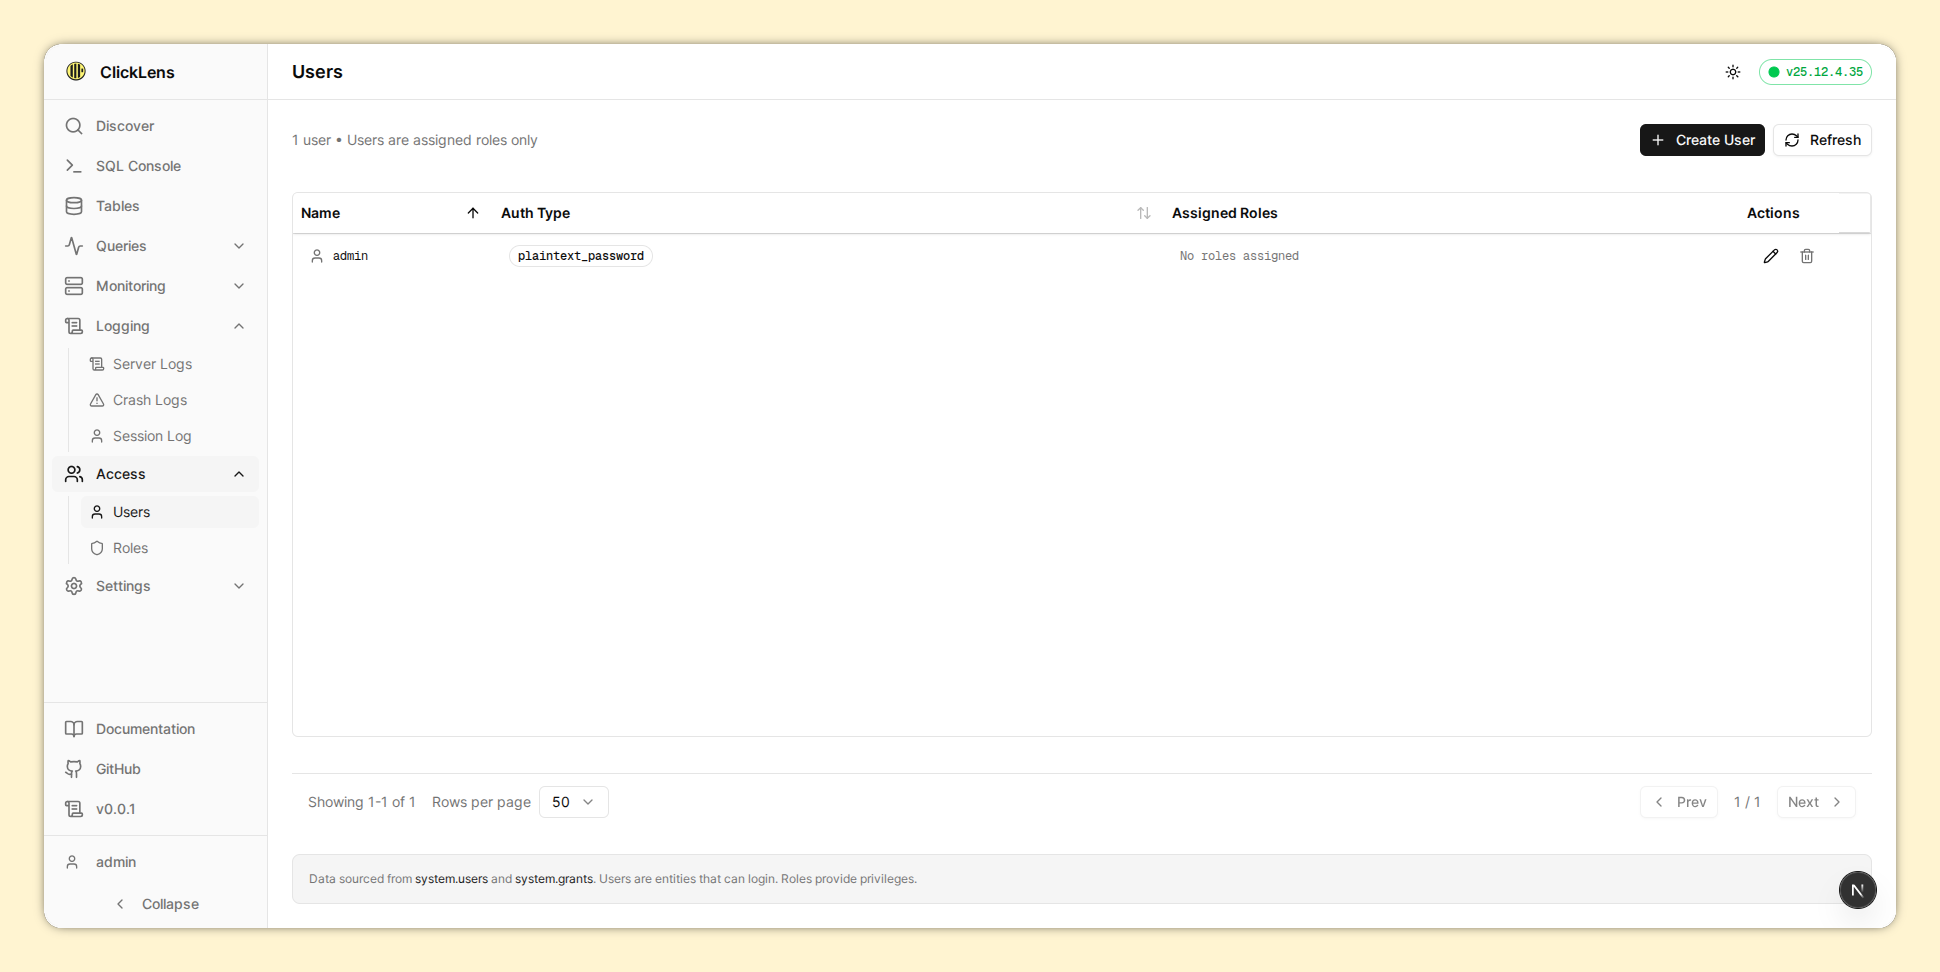
| Users | /access/users | List and manage database users |
| Roles | /access/roles | Manage roles and their grants |
View all ClickHouse users:
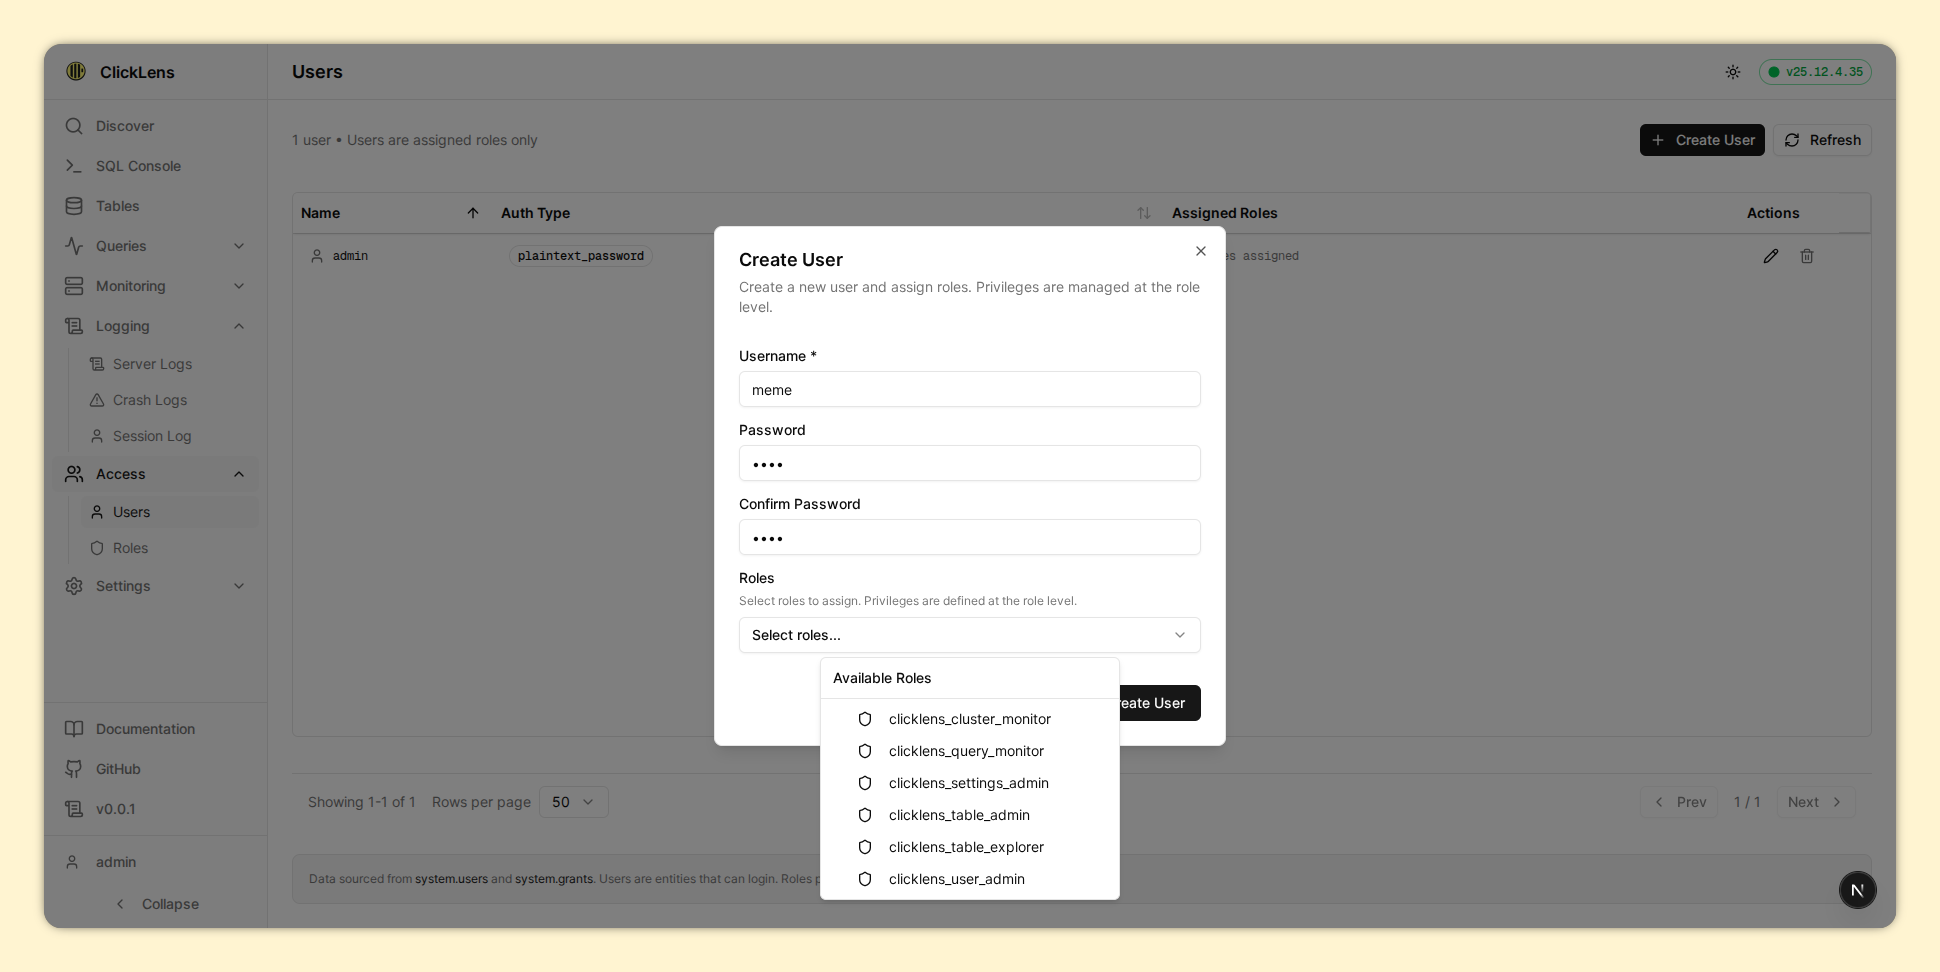
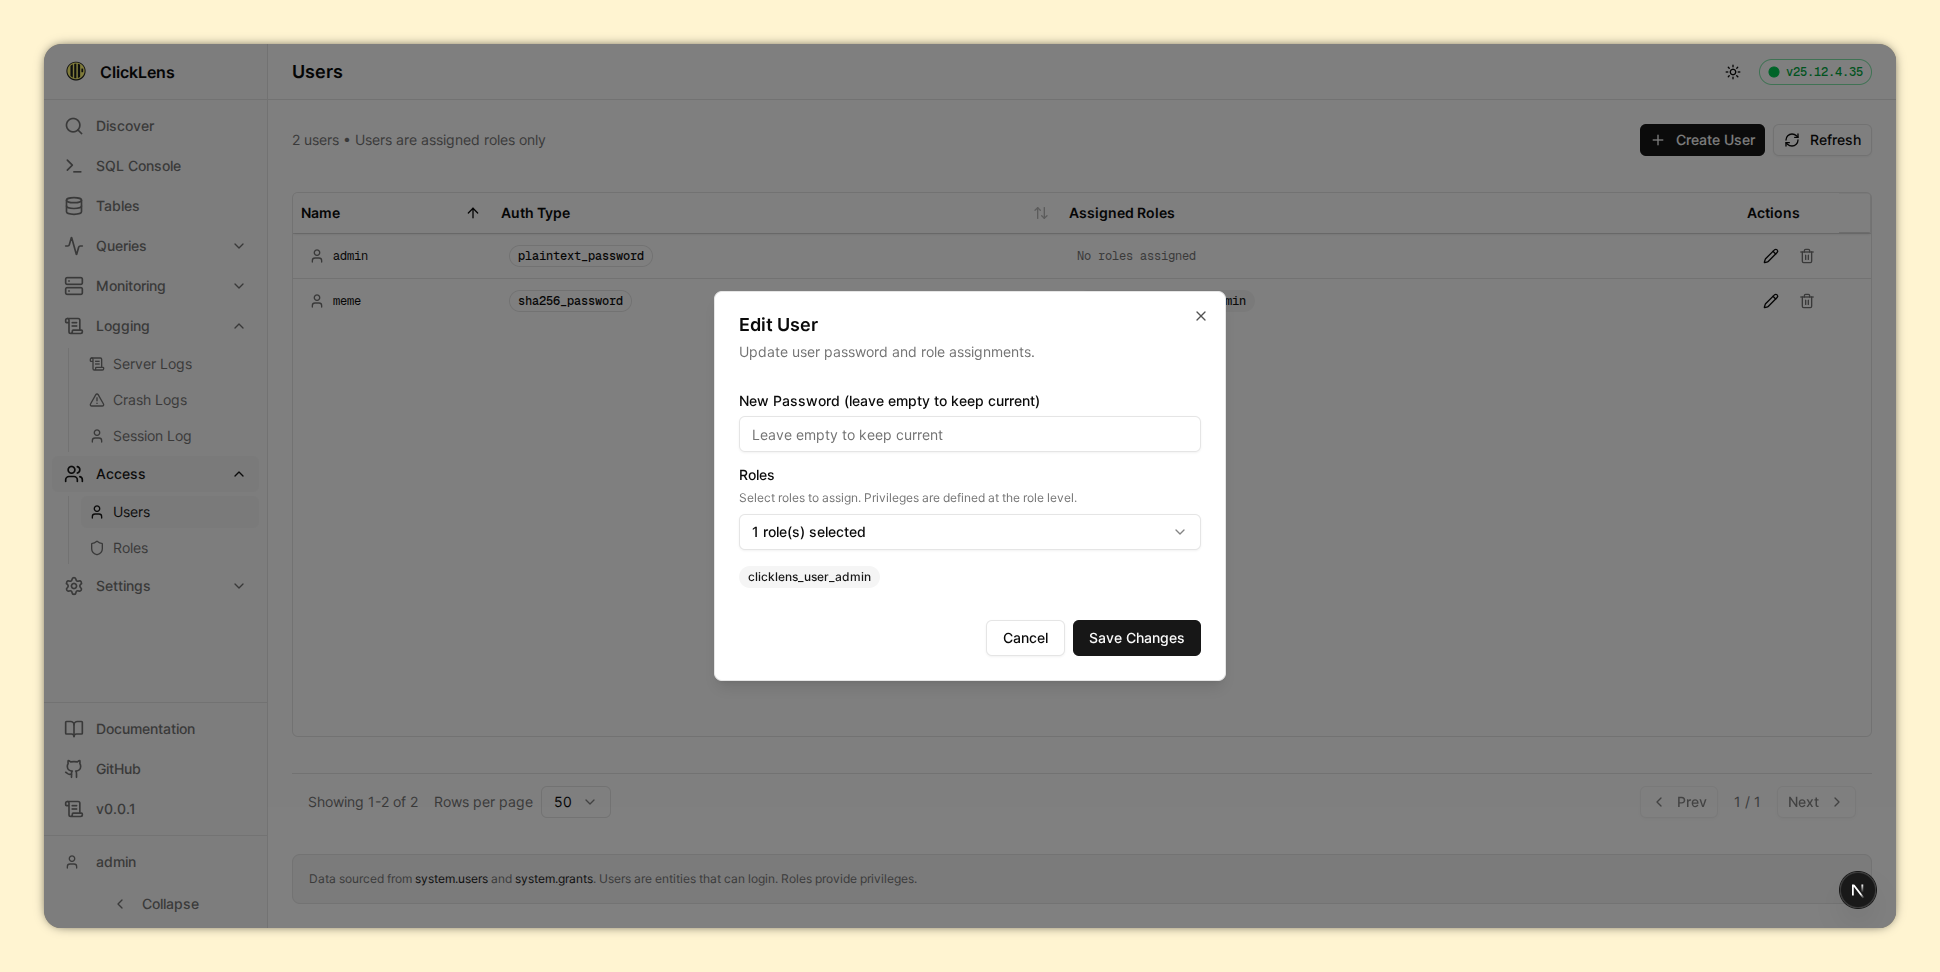
Create/Edit user and grant role(s):
View roles. There are two types of roles:
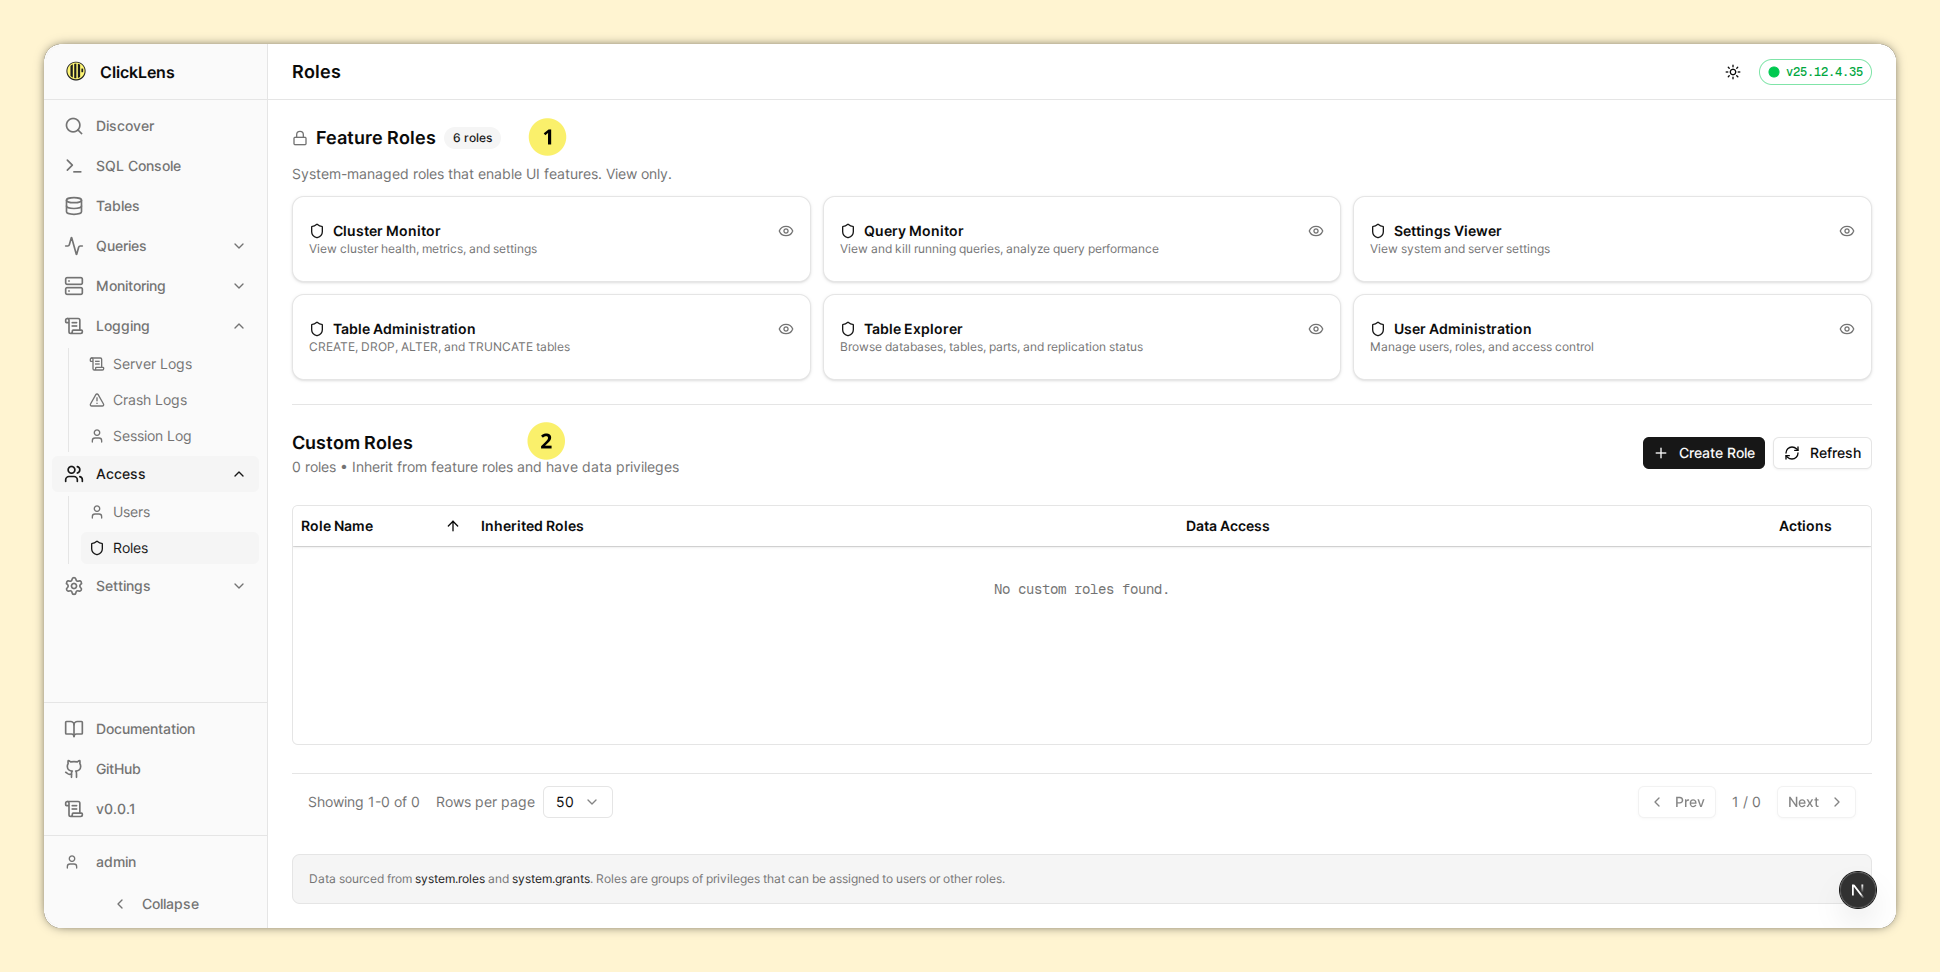
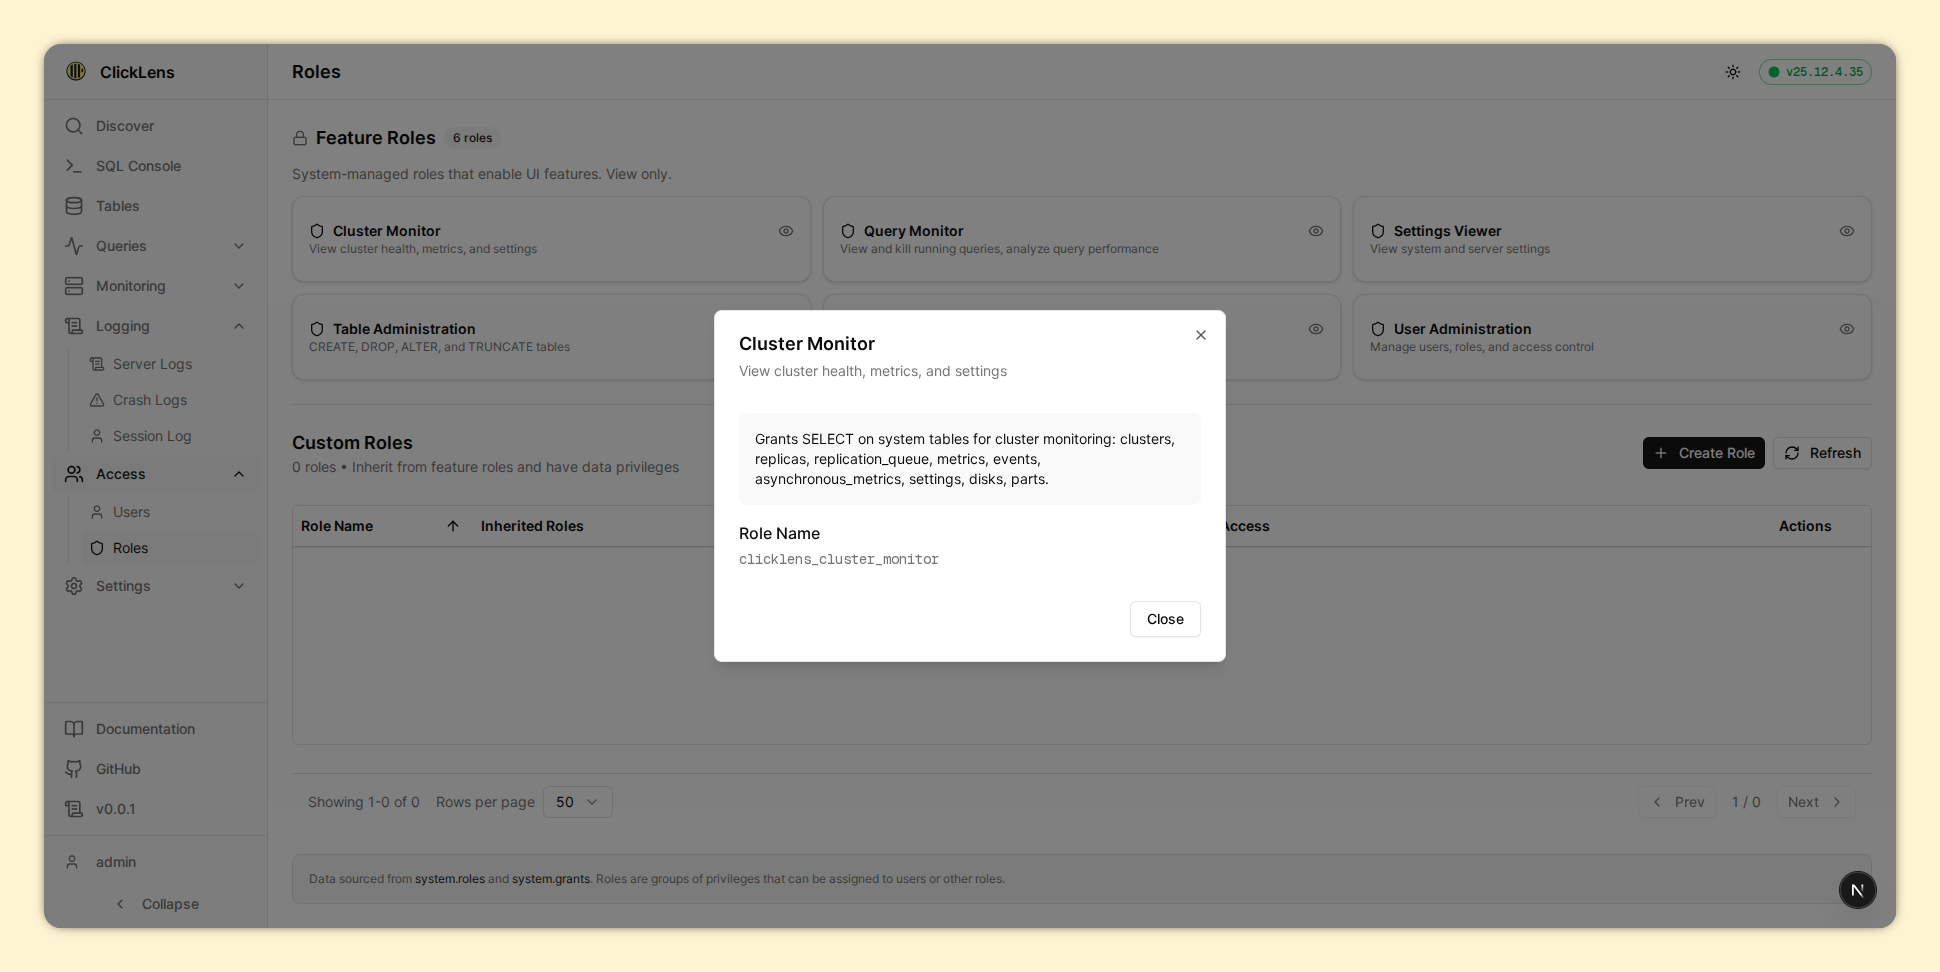
- Feature roles: System-managed roles that enable UI features. These are read-only and can be viewed by clicking on each role.
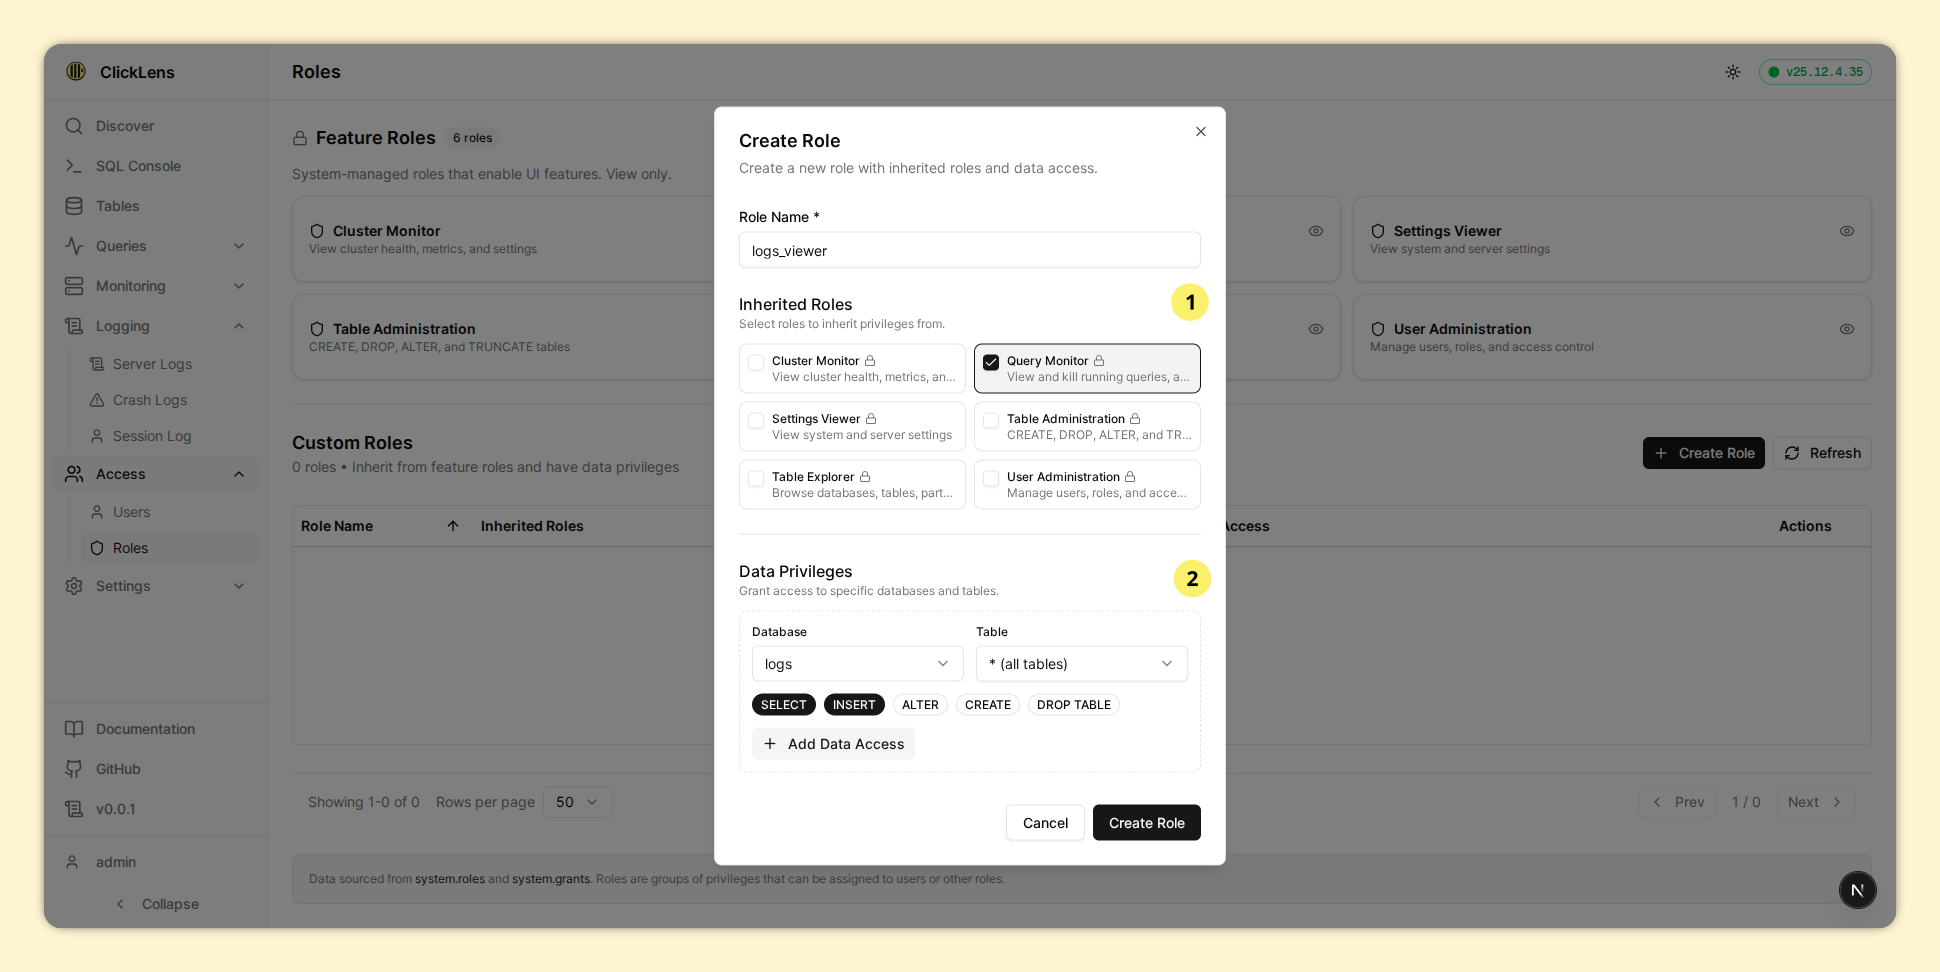
- Custom roles: User-created roles containing two types of permissions: inherited roles and data privileges. This allows for flexible role configuration.
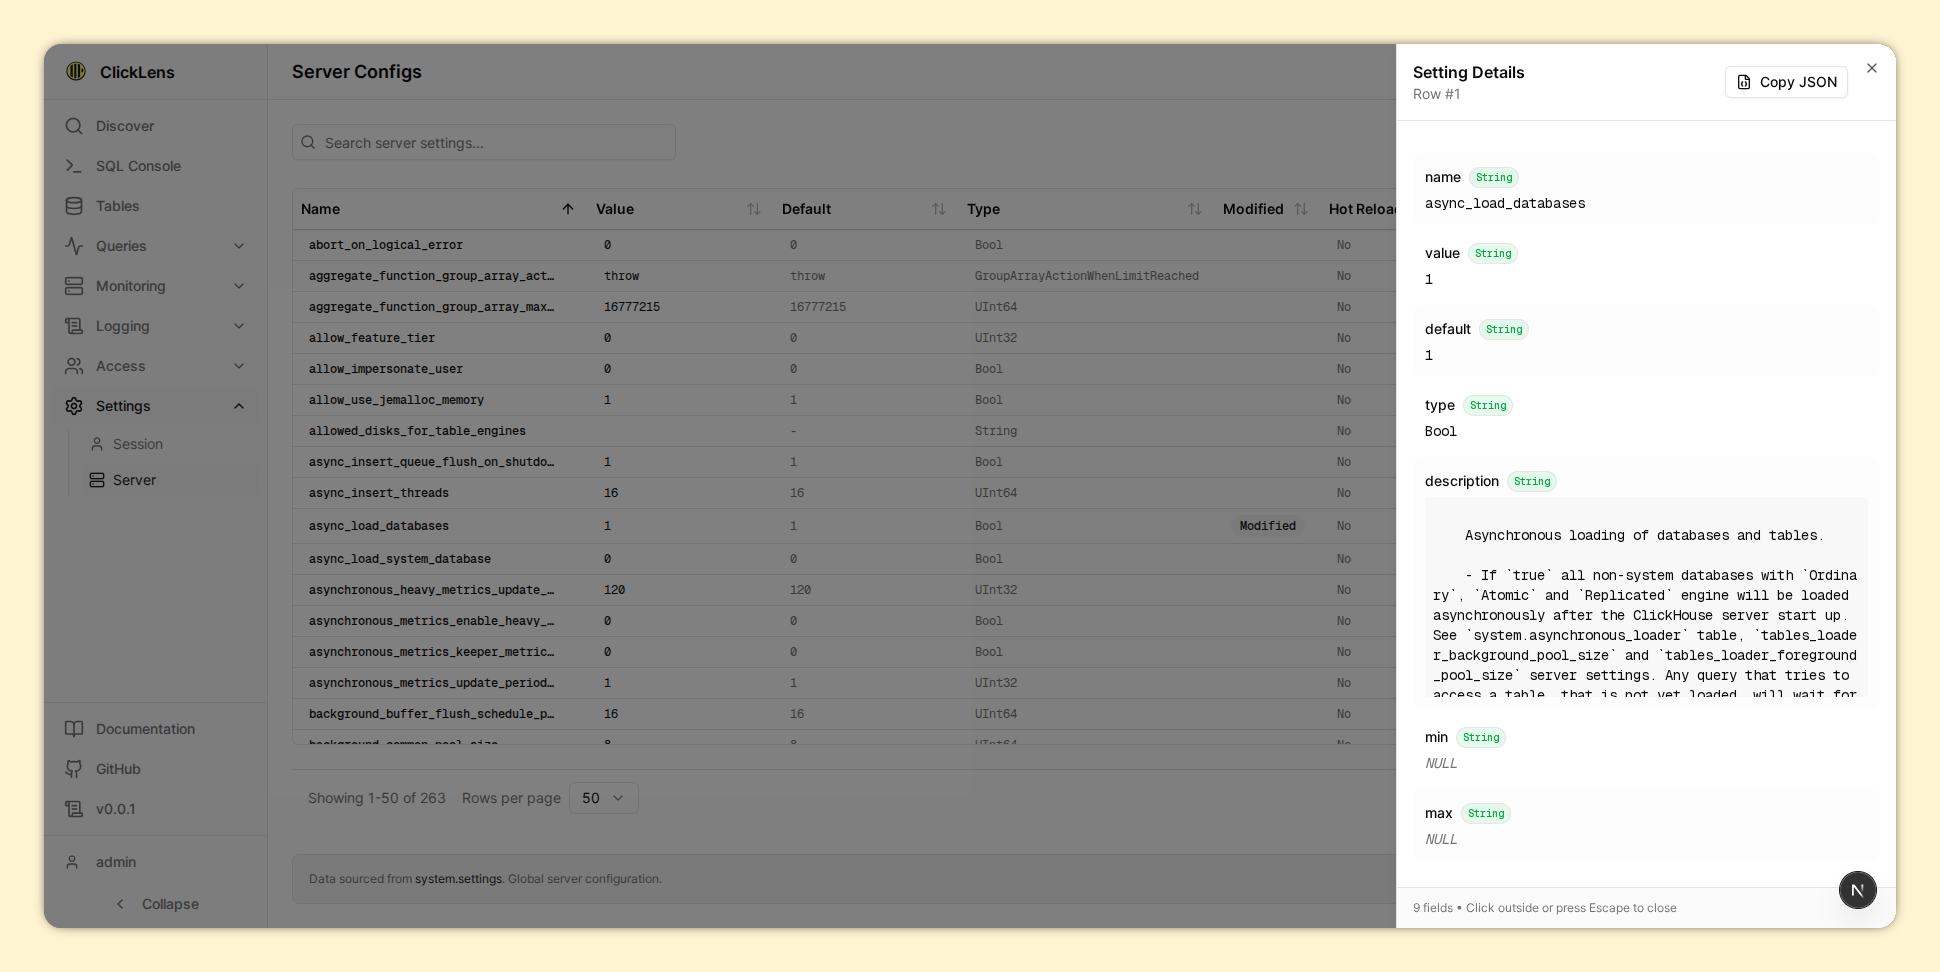
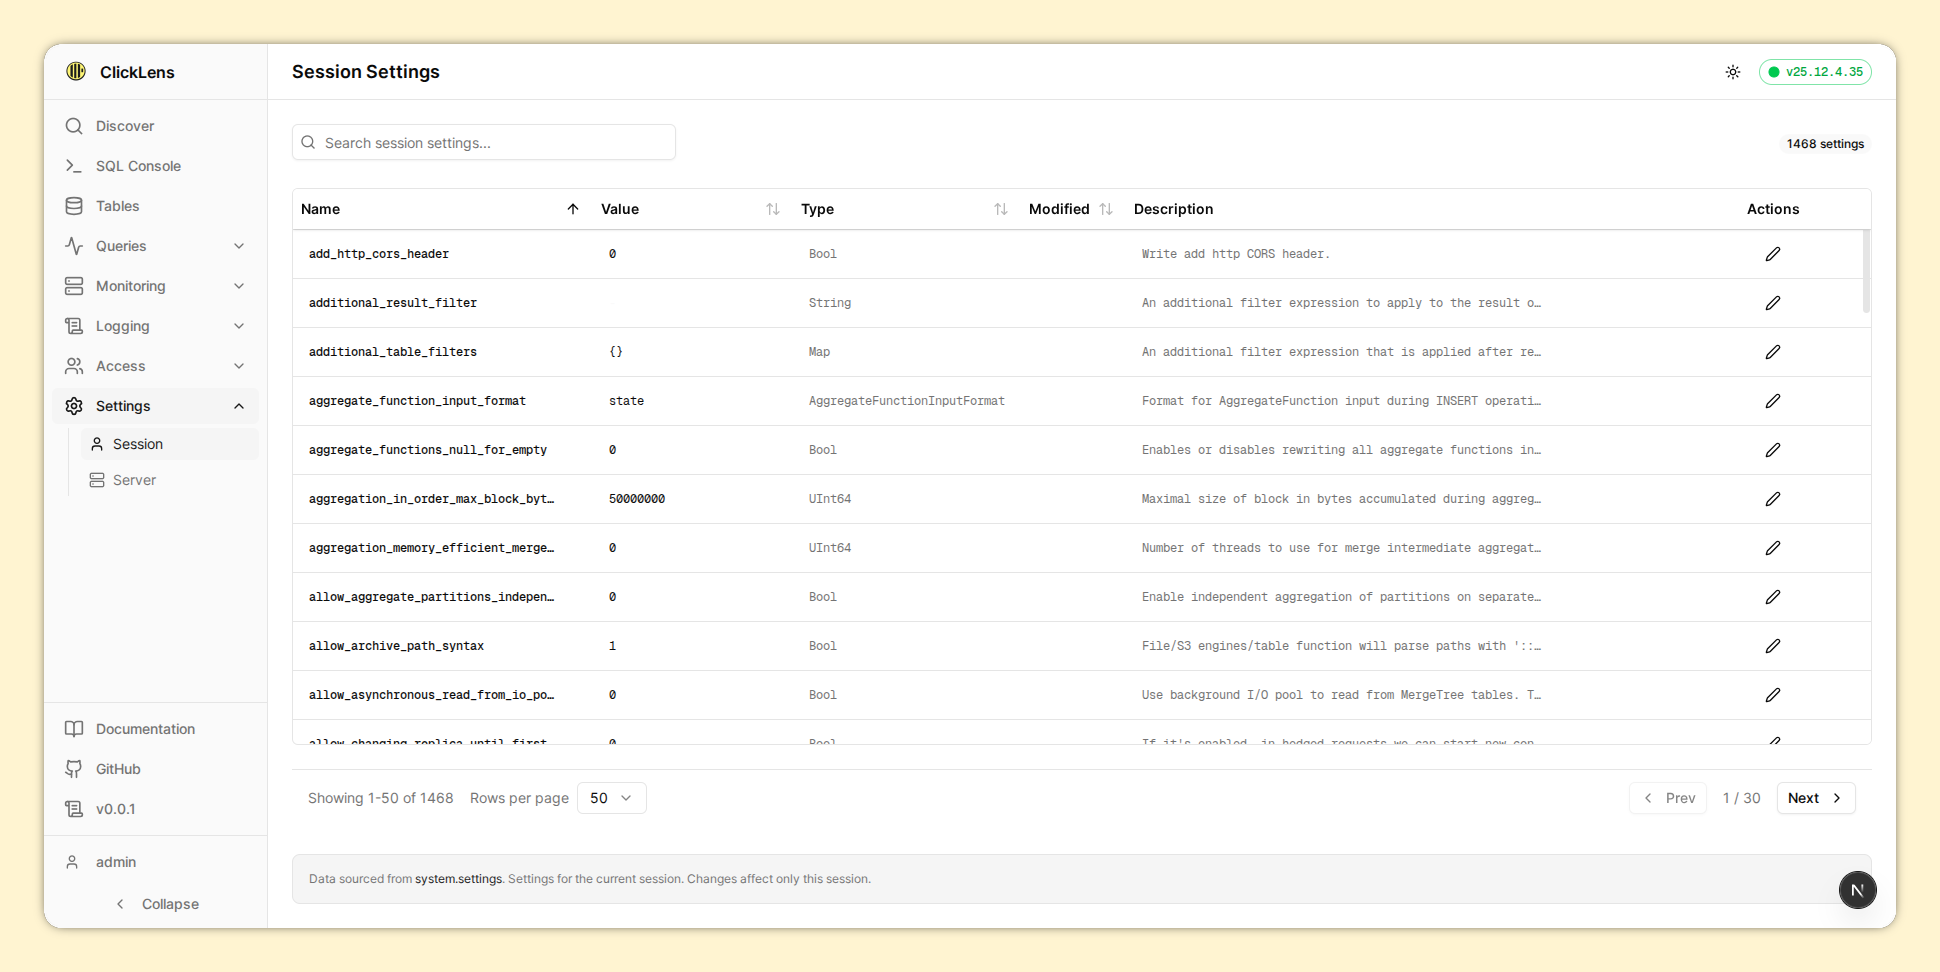
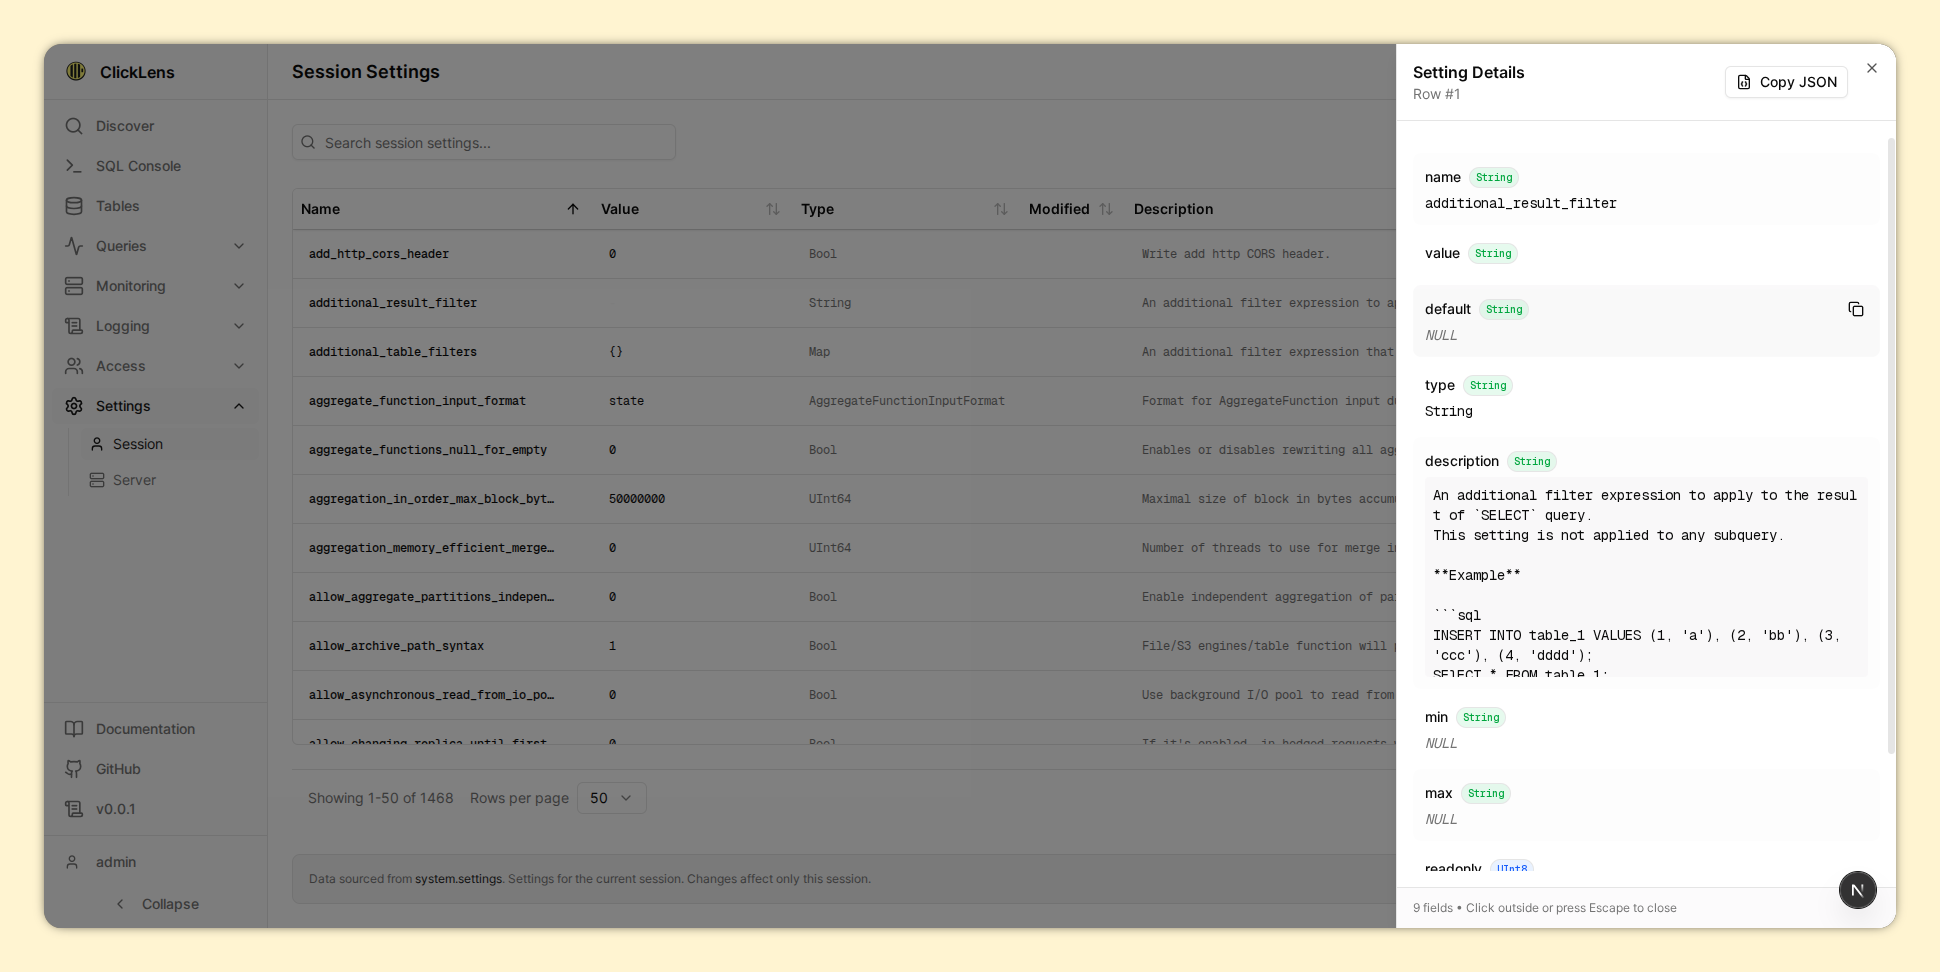
8. Settings
View ClickHouse server and session settings.
Requires canViewSettings permission. This is derived from having
SELECT on system.settings.
8.1. Available Views
| View | Route | Description |
|---|---|---|
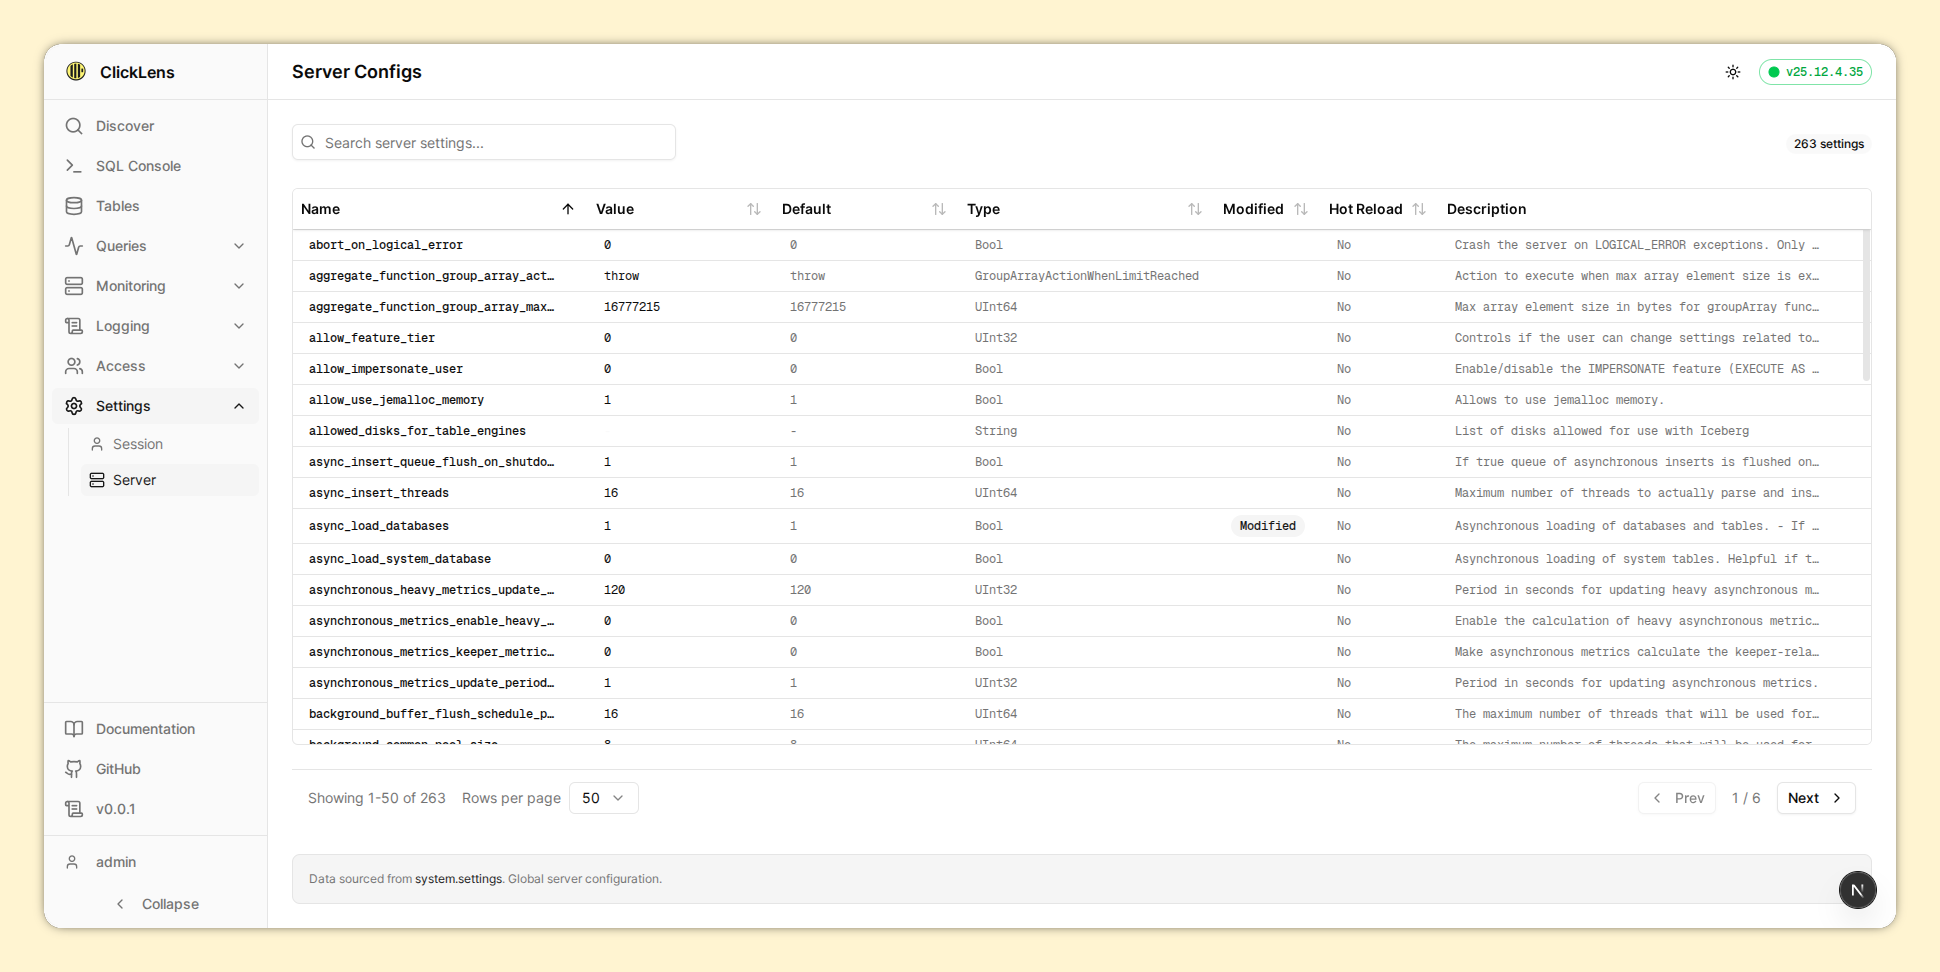
| Server Settings | /settings/server | Read from system.server_settings, contains information about global settings for the server, which are specified in config.xml |
| Session Settings | /settings/session | Read from system.settings, contains information about session settings for current user |
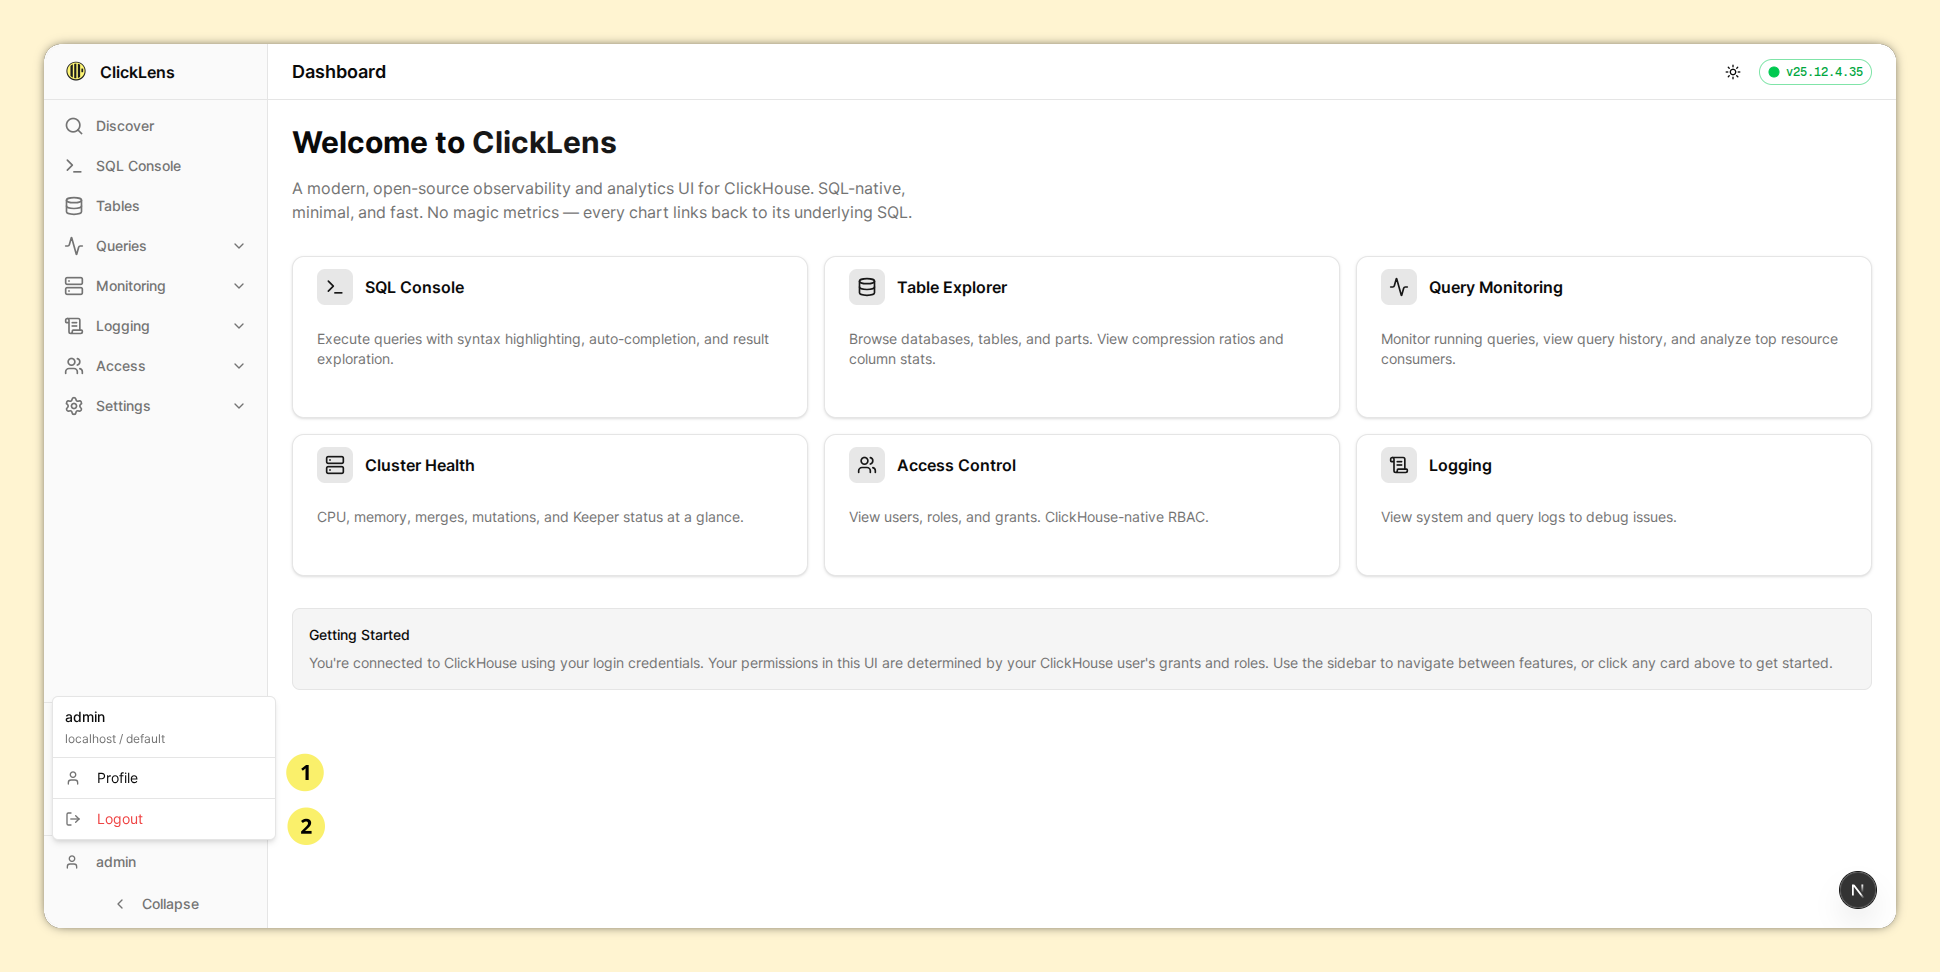
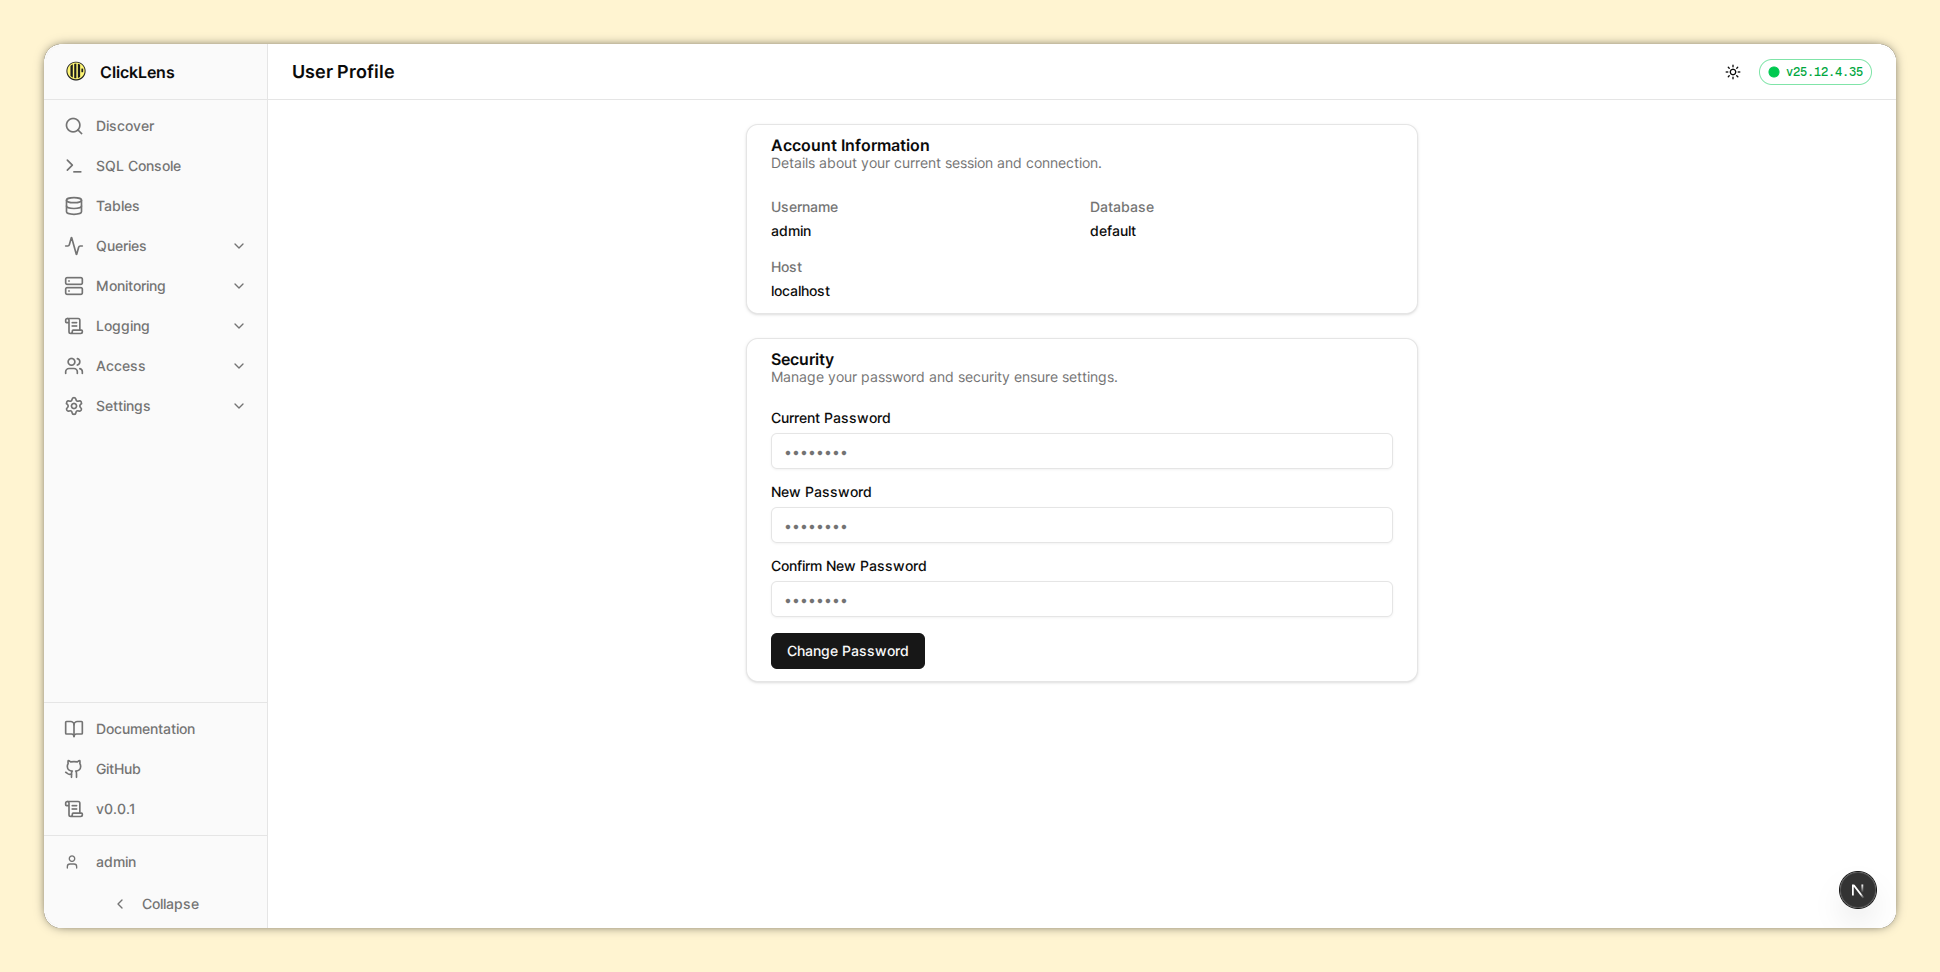
9. Profile
Users can view their information and change the password.